Dual tracking of MPP for PV under diffuse irradiation and
urban microclimatic conditions using sub-interval prediction
via Bayesian-optimized regression
Optimal power extraction from a photovoltaic (PV) plant in urban and rural areas varies due
to microclimatic conditions and diffuse irradiations. Traditional methods such as Perturb and
Observe (P&O) and Incremental Conductance (INC) are used in urban and rural PV power
plants. Diffuse irradiation and microclimatic conditions are different in urban and rural areas.
Moreover, one of two sides of the PV characteristics is used for tracking the maximum power
point (MPP), i.e., either constant voltage or constant current region. In this paper,
a Bayesian-optimized multiple regression-based dual tracking (BM-DT) is proposed for a
sub-intervals prediction technique (SIPT) and the tracking of MPP is done using both sides
of the PV characteristics. Moreover, the voltage step used for tracking the MPP is not a fixed
quantity and is predicted using BM. The proposed BM-DT technique predicts sub-intervals
from a specified initial voltage interval. Moreover, the maximum power point is tracked
through interval and SIPT, based on microclimatic conditions. As tracking is done along
both sides of the photovoltaics (PV), the performance with outstanding power extraction
efficiencies at low, medium, and high power levels is 99%, 99.2% and 99.4%, respectively.
Introduction
Optimization methods are used in maximum power point
tracking (MPPT) for maximum power extraction. MPPT
algorithms are selected based on the pattern of irradiation
on all photovoltaic (PV) cells/modules, such as uniform
irradiation and non-uniform irradiation. Uniform
irradiation leads to more power delivery from the PV
modules rather than non-uniform irradiation.
Many techniques were proposed for MPPT under
uniform and non-uniform irradiated conditions. Most of the
techniques implemented in MPPT are for uniform
irradiation, with a control algorithm that is less complex
and faster in convergence. MPPT techniques used for nonuniform
irradiation conditions are complex in nature and
require an effective control technique for convergence.
Another categorization of the MPPT methods for PV
modules are off-line and online methods. In the online
method, the PV module operating parameters, such as
module terminal voltage (Vpv) and current (Ipv), are
regularly measured and processed through the control
algorithm. The control algorithm tracks the maximum
power point (MPP) continuously, increasing the efficiency
of the PV system.
The traditional on-line methods, such as Perturb and
Observe (P&O) and Incremental Conductance (INC)
methods, are used in the MPPT. Many new methods have
been developed to improve MPPT performance by
adjusting control parameters. Modified P&O and INC
methods focus on step size, where the step sizes are
modified with respect to dP/dV [1], dP/dI [2], dI/dD [3],
dP/dD [4] in the entire range of control space. Based on the
above parameters, the adaptation is tuned empirically and
hence loses generalization [2].
In specific modified P&O methods, the PV curve is
divided into several sectors/regions and the step sizes are
modified based on the voltage sector/region on the PV
curve in which the operating point lies [5–6], and in another
similar variant, the step size is modified based on the
distance of the operating point from the MPP [7]. Another
modified P&O method incorporates a momentum term to
the step size, where selecting a momentum factor was
crucial for faster tracking [8]. In [9], the P&O method is
based on multi-sampling of the neighbourhood, which
determines the direction of tracking on the PV curve under
varying irradiation to avoid incorrect tracking.
In a few variants, the step size is modified only around
the MPP at a steady state [10–11] and reduces the oscillations
in MPP. Few methods change the PV parameters,
such as PV voltage, power, and current and determine the
perturbation size for the next iteration, enhancing the
tracking performance during varying irradiation conditions
[12–14]. Optimization-based MPPT methods track MPP
for an optimal operating point based on the parameters of
the PV module [15–19]. Existing MPPT methods are
complex and need many PV parameters leading to high
computational costs.
Different intelligent techniques are used in MPPTbased
intelligent control methods, each with several stages
of implementing a specific module [20–24].
In [25], an MPPT controller has a boundary controller
using a second-order switching surface in the inner control
loop and tracks the reference voltage generated by the
dP/dV tracker in the outer loop. This dP/dV tracker tracks
the PV characteristics using samples of two consecutive
points along the constant voltage or the constant current
region. Furthermore, the switching instants of the switch in
the converter depend on the geometry of the input capacitor
voltage and current, leading to a varying switching frequency
under transient periods.
Nowadays, integrated building PV with more efficient
PV modules using good transparent conductive oxide have
become popular [26], where installations in urban regions
require low reflectance value by using texturized glasses,
which ultimately reduces the electric power output by
around 5% [27]. Hence, under such circumstances, MPPT
is essential to extract the remaining available power
without much loss.
Research questions (RQ)
(RQ1) Do the microclimatic conditions influence
solar irradiations, and how can the MPP be
implemented for maximum power extraction?
An attempt has been made to develop a new method for
the MPPT technique which has less complexity and
computational burden but has fast tracking and generalization
by invoking voltage intervals and then making
them converge towards the MPP under uniform irradiation
conditions. Such a conceived method, Bayesian-optimized
multiple regression-based dual tracking (BM‑DT) is presented
in this paper. The proposed sub-interval predicting
technique (SIPT) method, also presented in this paper,
consists of BM-DT that predicts the voltage interval along
with microclimatic data which are used to fix the new
intervals in such a way as to reach the MPP without
divergence.
RQ2) How to improve the MPP during the diffuse
irradiation (DI) which occurs in the urban area and
extract maximum power from a PV array?
The proposed BM-DT method tracks the MPP along both
sides of the PV characteristics, one along the constant
current (CC) region and the other along the constant
voltage (CV) region towards the MPP. These two tracking
processes follow one after the other in the convergence
process. The BM-DT is proposed for SIPT. The BM-DT
method presented in this paper uses the module general
data, microclimatic data of panel planted such as urban/
rural areas, and also periodically measures the module
terminal voltage and current to implement the control
algorithm to track the MPP effectively along with urban/
rural microclimatic data. The module data are required with
microclimatic data to implement the presented algorithm,
which are the open circuit voltage Voc and the MPP voltage
Vmpp both at a standard test condition (STC) and can be
easily obtained from the specification sheet provided by the
manufacturer. No special efforts are required to obtain the
same and the microclimatic data are included in the MPP,
which is obtained from weather monitoring sensors.
I-V and PV characteristics of a PV module
Characteristics of a PV module are non-linear due to the
presence of a PN junction in every PV cell. The generation
of a PV current is linearly dependent on the level of
irradiation. The non-linear mathematical model of a PV
module current vs. voltage characteristics is represented
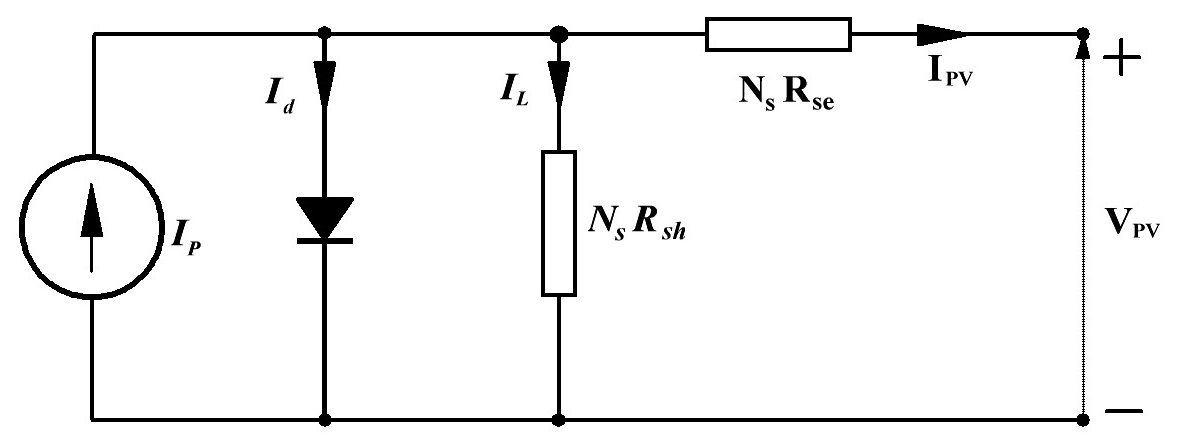
in (1) [28]. The corresponding single-diode electrical
equivalent circuit model of a PV module is shown in Fig. 1.
Fig. 1. Single-diode electrical equivalent circuit model of a PV
module.
where Vpv is the PV module output voltage, Ipv is the PV
module output current, Ip is the photocurrent produced due
to irradiation, Ios is the reverse saturation current, VT is the
thermal voltage, Ns represents the number of cells in series,
Rsh is the shunt resistance, Rse is the series resistance and
the ideality factor of the PV cell.
As the adaptation time of the proposed method is
shorter compared to changing environmental parameters
such as module temperature, location humidity, and wind
speed impact, a simple model of the PV modules is
considered.
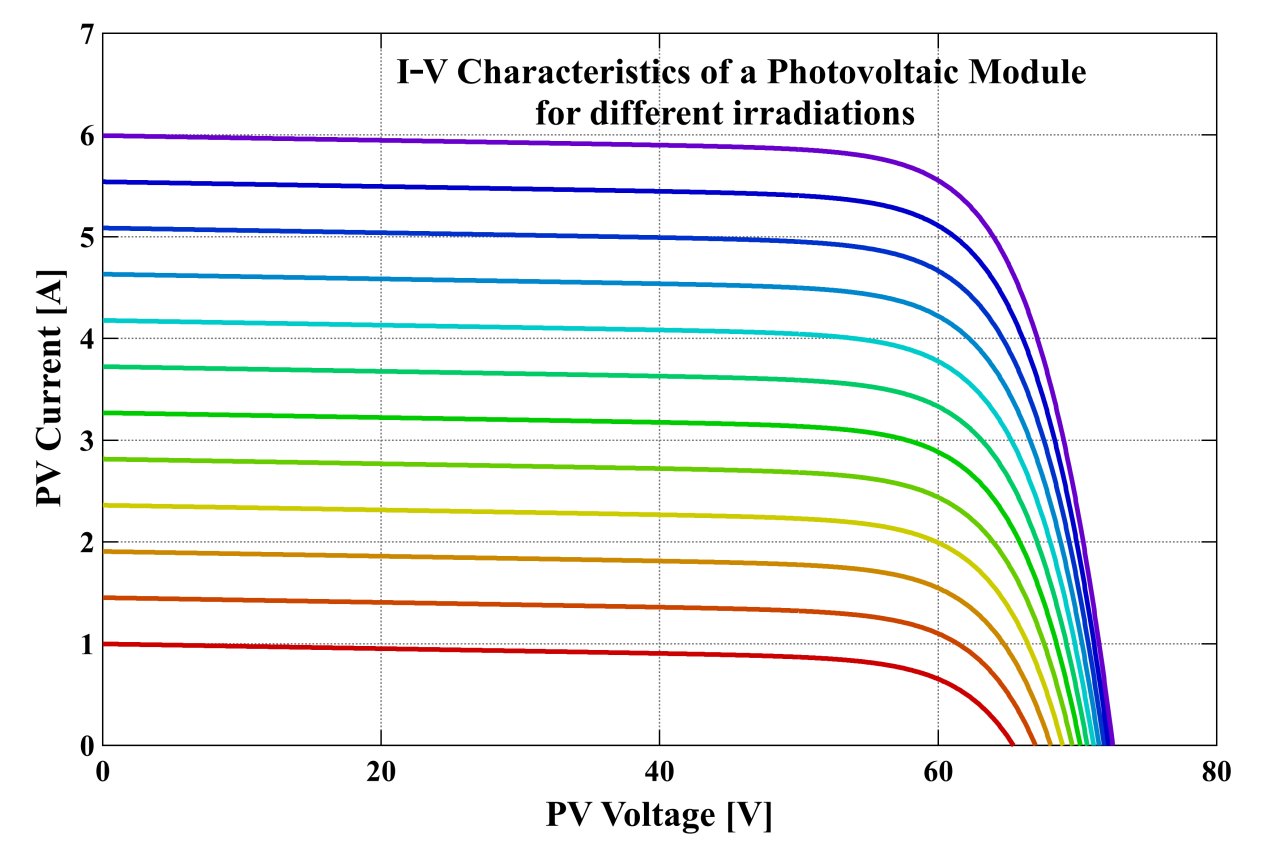
A graphical representation of the I-V characteristics is
shown in Fig. 2, which was obtained by solving (1)
numerically through the Newton-Raphson method for
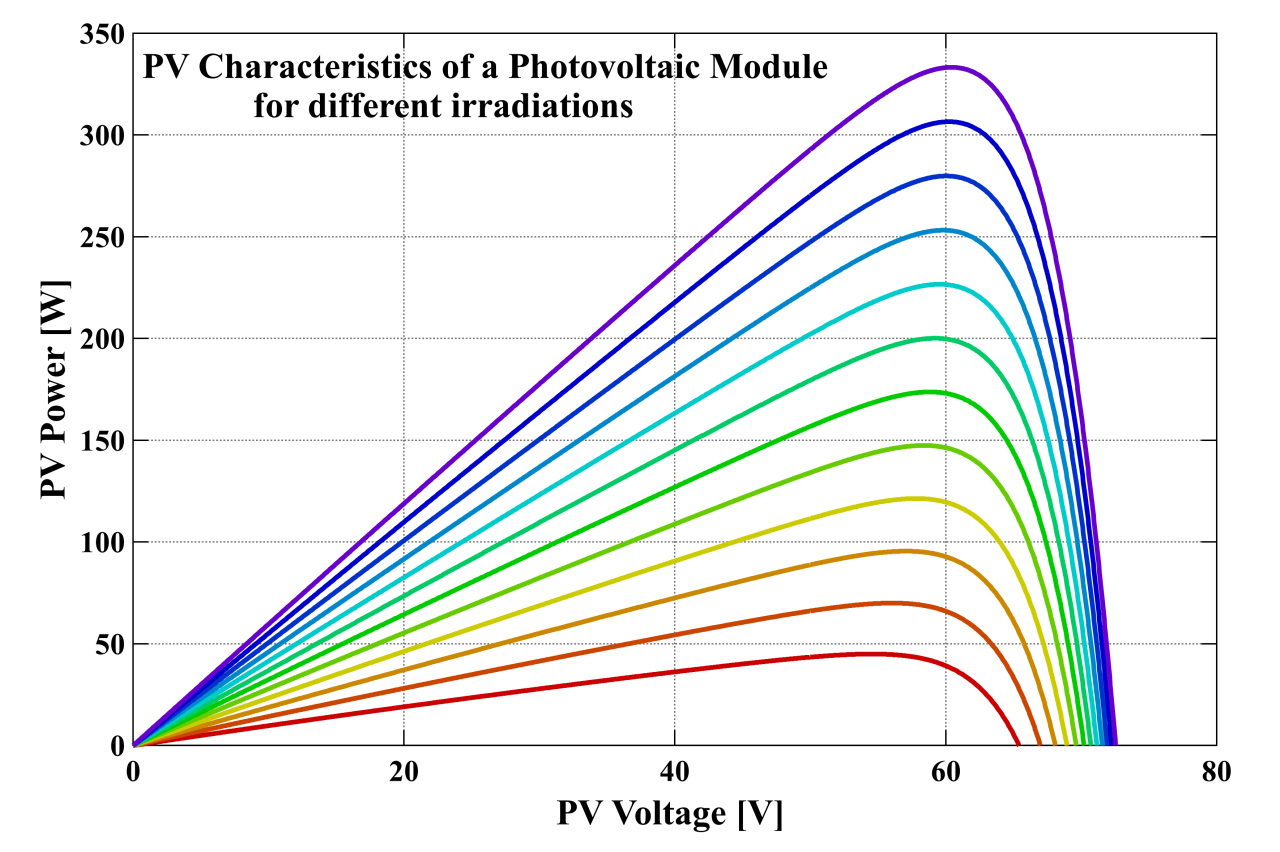
different uniform irradiation levels. Similarly, the PV characteristics of the PV module shall be obtained numerically and plotted in Fig. 3 for different uniform irradiation levels. It is obvious from Fig. 2 and Fig. 3 that both the I-V and PV characteristics are non-linear, and the PV characteristics exhibit unique points at which the power delivered through the PV module is at the maximum, and such points are known as MPPs.
Fig. 3. P-V characteristics of a PV module for different irradiations.
To extract maximum power from the PV module under the prevailing environmental condition, a power electronic converter circuit is interposed between the PV module and the load. The converter is operated using control techniques and different algorithms.
Dual tracking sub-interval predicting technique (SIPT) of MPP
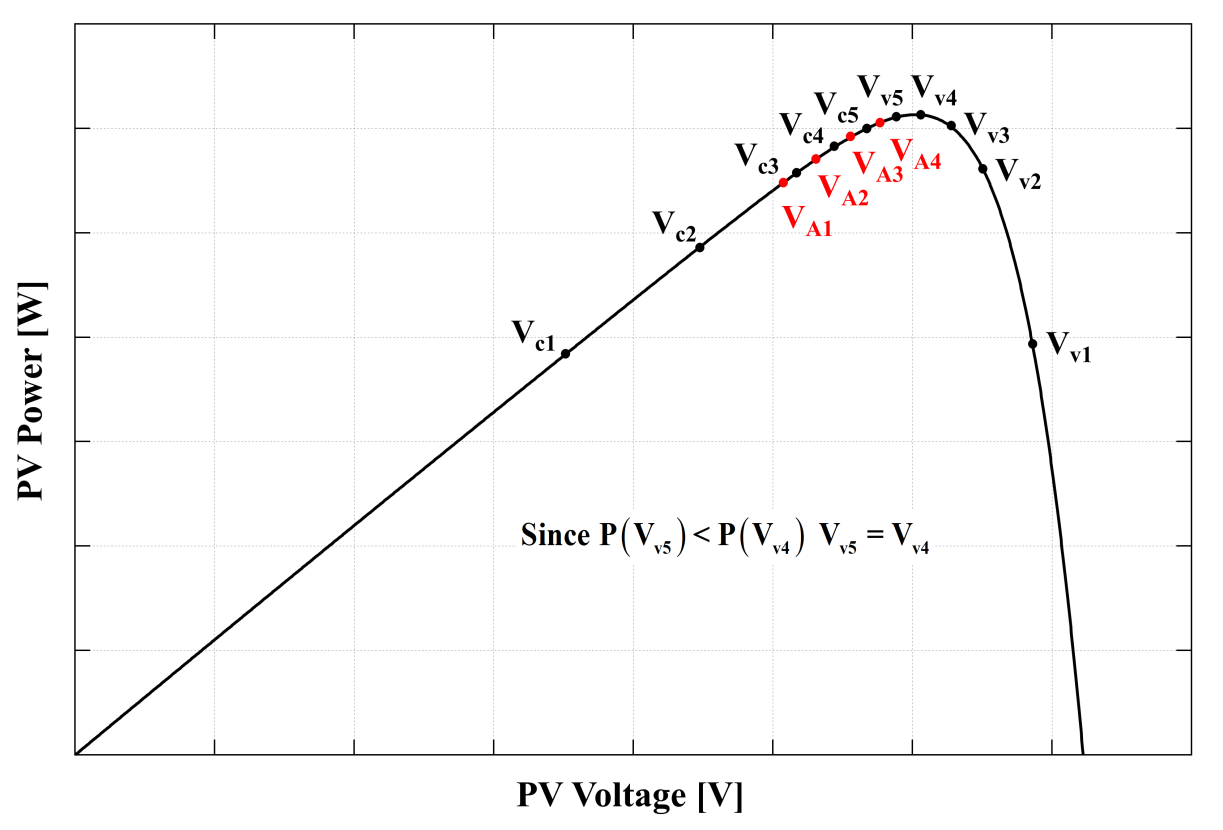
The proposed SIPT method presented in this paper consists of BM-DT, which predicts the voltage interval along with microclimatic data, which is used to fix the new intervals in such a way as to reach the MPP without divergence. The method is graphically illustrated in Fig. 4.
Fig. 4. Concept of a dual tracking sub-interval prediction technique (SIPT) of MPPT with microclimatic data.
Bayesian-optimized multiple regression for dual tracking (BM-DT)
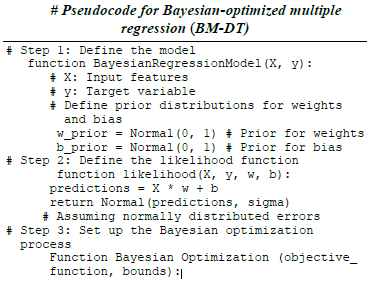
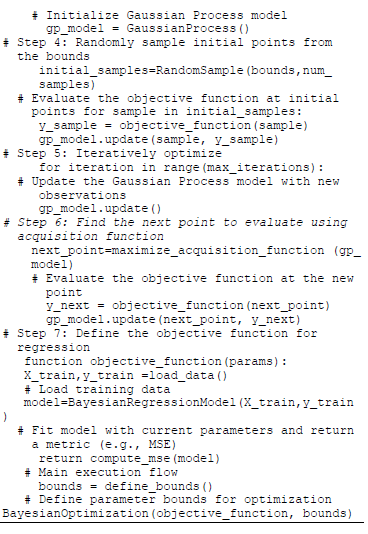
Bayesian optimization automates the search for optimal hyperparameters in regression models, which is often a resource-intensive process. Bayesian optimization uses the Gaussian process and predicts the performance of different hyperparameter combinations based on previous evalua-tions. This method focuses on the hyperparameter space leading to better results due to lower mean squared error, adaptability, and uncertainty management.
Bayesian optimization provides a natural framework for quantifying uncertainty in predictions. It captures the inherent variability in data and model predictions by generating posterior distributions for model parameters rather than point estimates. This capability allows practi-tioners to construct credible intervals around predictions, offering insights into their reliability. The advantages of BM-DT are robustness to outliers, model flexibility, and improved model selection.
Bayesian optimization facilitates model comparison by calculating posterior probabilities for different models. This capability enables practitioners to select models based on performance while taking into account uncertainty and prior beliefs about model effectiveness. Bayesian optimization helps identify which model best explains the data while considering uncertainty in parameter estimates.
Recent advancements in Bayesian linear regression allow for scalable approaches that maintain efficiency even as data size increases, making them suitable for small datasets. Bayesian optimization enhances multiple regres-sion models by streamlining hyperparameter tuning, effectively managing uncertainty, and facilitating robust model selection. This leads to improved predictive accuracy and reliability in various applications across data science and machine learning domains.
An initial voltage interval is fixed based on the PV
module open circuit voltage Voc and the maximum power
point voltage Vmpp at STC given in the specification sheet
by the manufacturer. One of the voltage interval points is
on the CC region, which is fixed between 0 V and the Vmpp,
preferably greater than the mean of 0 V and the Vmpp, i.e.,
Vmpp/2. The other voltage interval point is on the CV region
which is fixed at or around the mean of the Vmpp and the
open circuit voltage Voc, i.e., (Vmpp + Voc )/2.
After fixing the initial voltage interval points, the DCDC
converter is operated so that the PV modules operate at
the predetermined voltage interval points, called Vc0 and
Vv0, one by one, and the respective output power delivered
by the PV modules, i.e., P(Vc0) and P(Vv0), is measured.
In the first iteration, the initial voltage interval points
are predicted with BM-DT, as in (2). Where α and β are
constant, H represents the humidity in %, T represents the
temperature of the area in °C and W represents the wind
speed in mph where the PV array is installed.
With the computed voltage VA0, the initial voltage
interval is sub-divided into two sub-intervals such as
[Vc0, VA0] and [VA0, Vv0]. Then, the new values of voltage
interval points are predicted from the sub-intervals using
the BM-DT, which are given by the following equations:
The PV modules are again made to work at these new
voltage interval points and the respective power delivered
by the PV modules at these new voltage interval points
aremeasured as P(Vc1) and P(Vv1).
The same procedure is followed in the second iteration;
however, before retaining the voltage interval points Vc1 and Vv1 for the next interval computation, a power check
needs to be performed, as stated below.
If P(Vc1) > P(Vc0), Vc1 is retained otherwise Vc1 = Vc0,
similarly if P(Vv1) > P(Vv0), Vv1 is retained otherwise
Vv1 = Vv0. Upon evaluation of the above criteria, the second
prediction is computed and these procedures are repeated
until a predetermined tolerance is satisfied for both the
power and the voltage interval points. It is clear that the
prediction optimization continues until the voltage interval
shrinks and eventually converges to a single point or closer
to each other when a predetermined tolerance for voltage
interval is satisfied, where the power delivered by the PV
modules will be at the maximum or very close to the
maximum power which depends on the tolerance.
In general, the interval average and the sub-interval
average, which are the voltage interval points for the next
iteration, are predicted as per the following expressions:
In the SIPT method of MPPT, at every iteration, both
sides of the voltage interval are adjusted and the adjustment
of the voltage interval is based on the prediction of the subintervals
created by the average of the interval.
General procedure of the proposed technique of
MPPT
Set iteration number ‘n’ to 0. Give initial values to the
voltage interval as Vc0 and Vv0 and drive the converter
to operate at these voltages consecutively.
Obtain the powers P(Vc0), P(Vv0) at Vc0 and Vv0,
respectively.
Predict the values of Vc0 and Vv0 as given by (2).
Increase ‘n’ and determine the new voltage interval
values given by the following expressions:
If either ΔP or ΔV violates the tolerance, increase ‘n’
and go to step 5; otherwise, go to step 14.
Stop changing the voltage intervals.
Apply perturbation to the final value of either Vc or Vv
for ‘N’ times to check for any change in irradiation
during iteration.
Check whether the power increases and exceeds
a predetermined threshold value.
If the power is increasing and greater than the
predetermined threshold value, proceed to step 1;
otherwise, proceed to step 18.
Continuously check for any change in irradiation level.
If not, repeat step 18; otherwise go to step 1.
Simulation of SIPT using BM-DT
The proposed SIPT method for MPPT is verified through
computer simulations. The computer simulations are carried
out with the help of a PLECS software. In the simulations:
start-up behaviour
dynamic behaviour when a change
in irradiation takes place before reaching a steady state,
dynamic behaviour when a change in irradiation takes
place after reaching a steady state of the SIPT method are
studied using BM-DT.
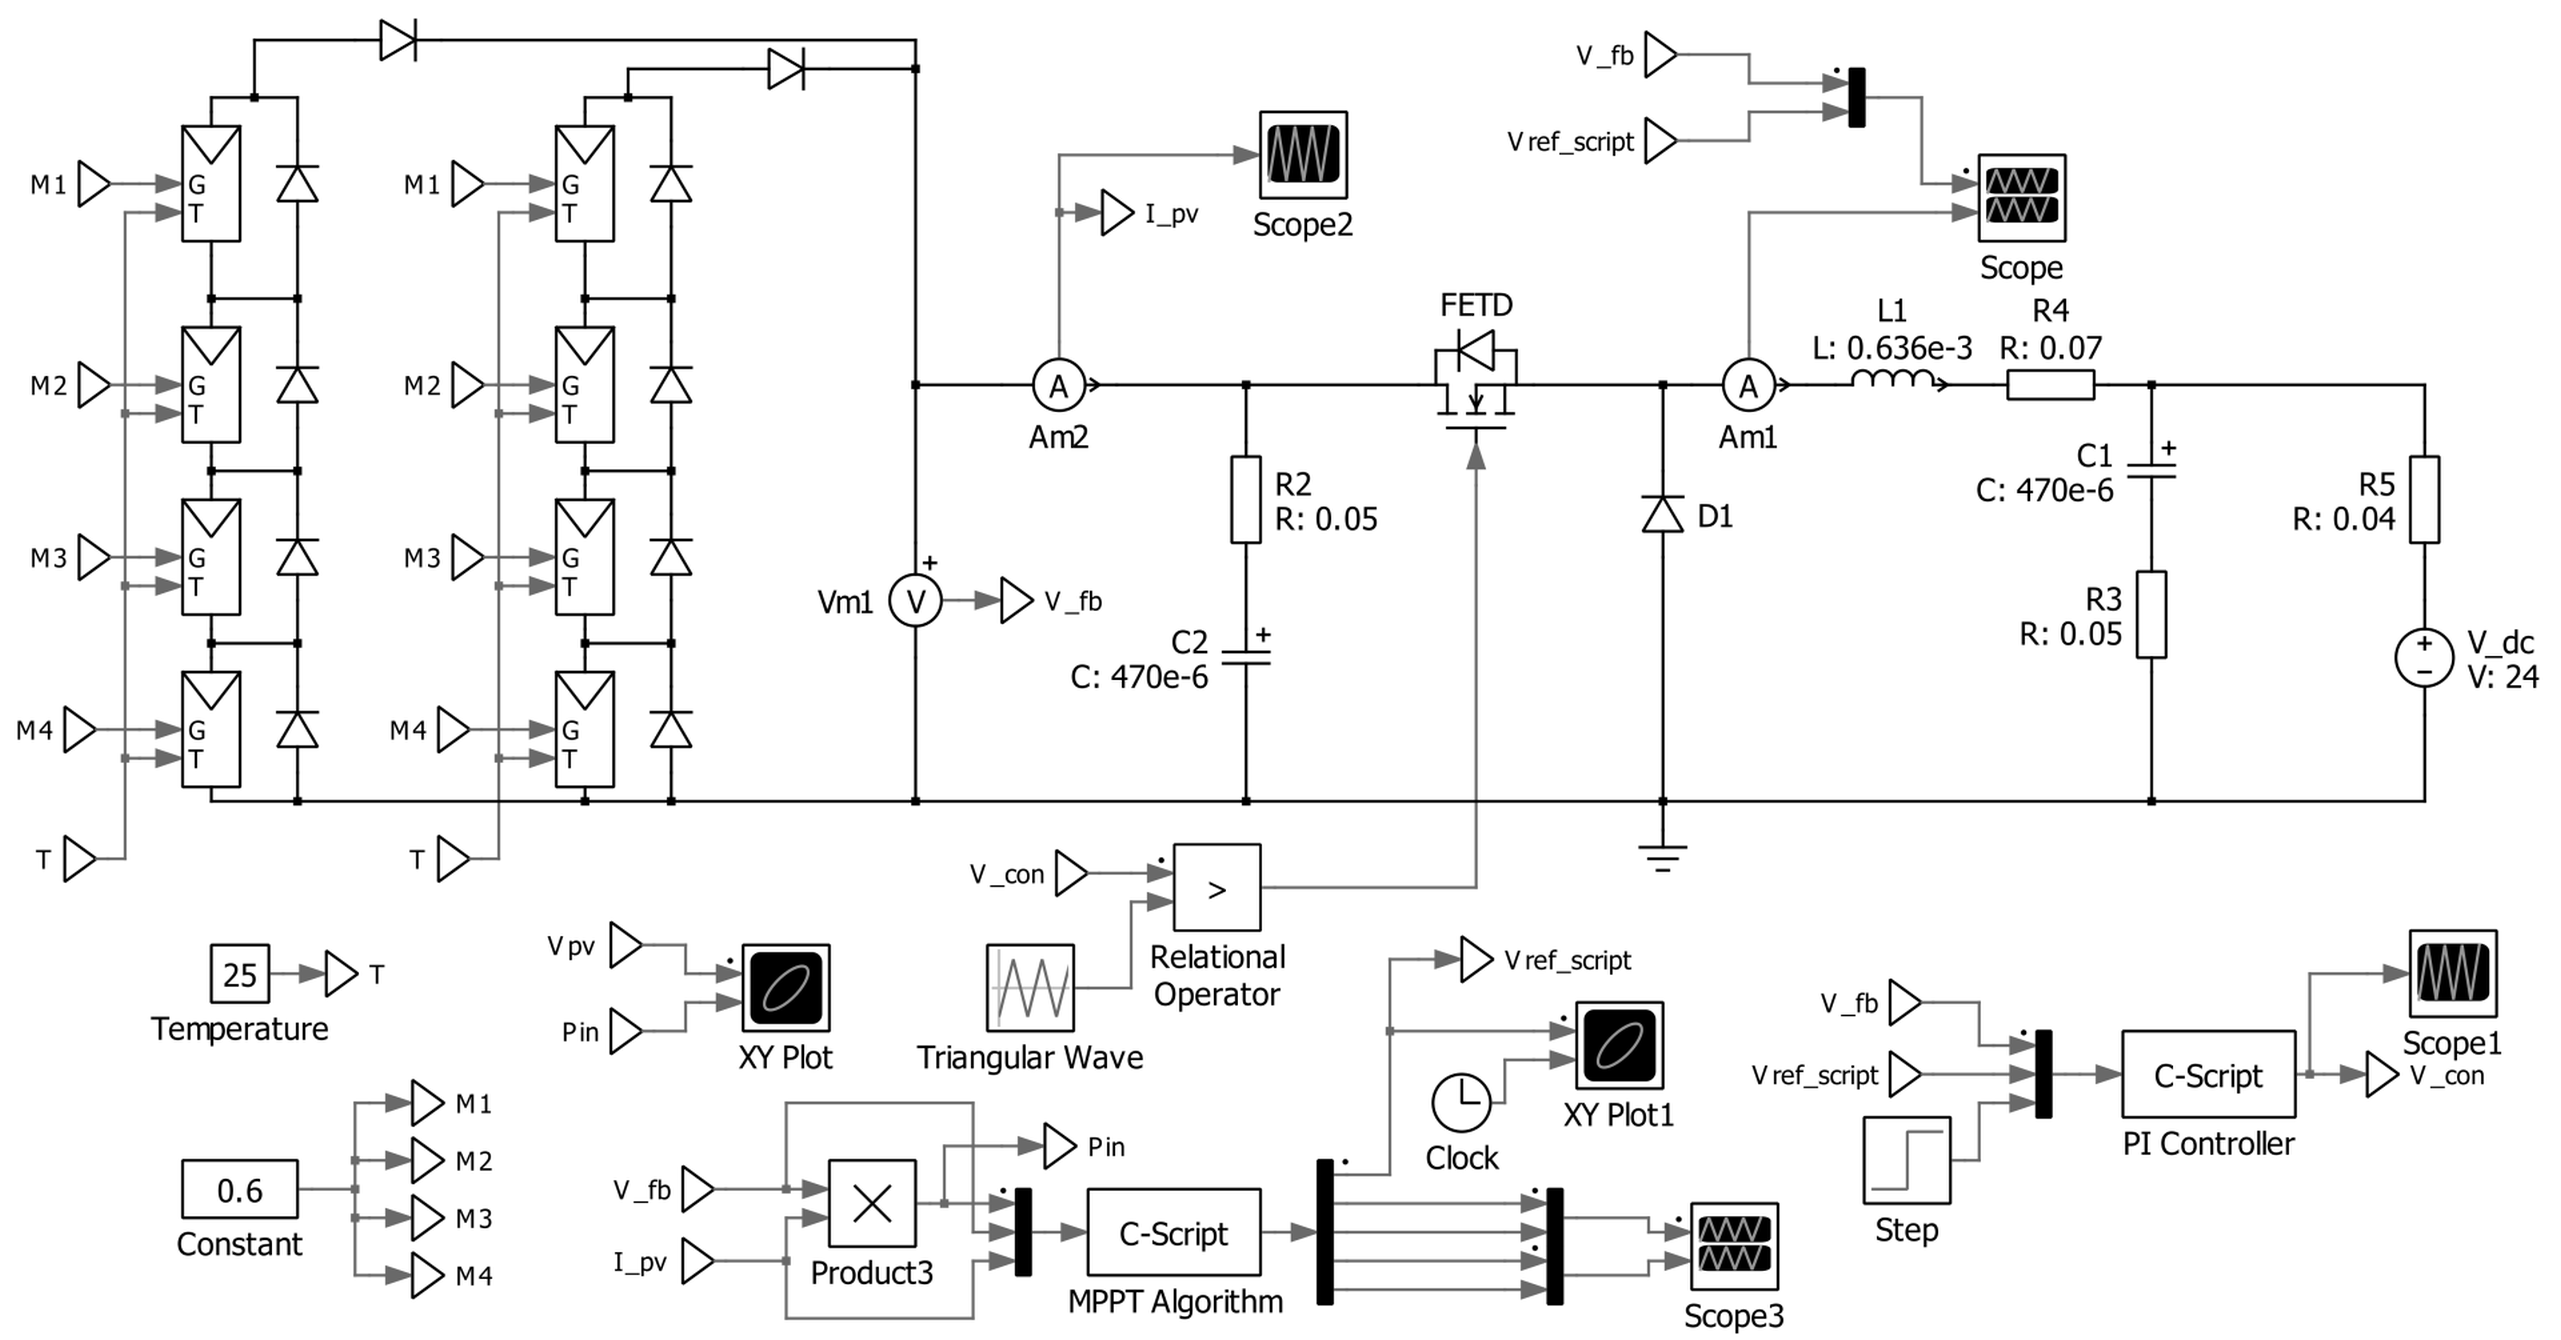
The schematic used for the SIPT method of MPPT is
illustrated in Fig. 5. The intended application of the
complete circuit is to charge batteries. A PV array,
consisting of two strings comprising three numbers of PV
modules all connected in series, is connected to two 12 V
batteries, connected in series through a buck converter. The
simulation study is configured with the intention of
determining the behaviour of PV power, voltage, current,
and their convergence when the SIPT method is deployed.
In all the cases, to visualize the convergence of the SIPT
method, illustrations are made by superimposing the time
variation of PV voltage and power to create power vs.
voltage trace. Furthermore, this research is meant for
uniform irradiation conditions and although the temperature
of the environment and module takes into account the
self-heating phenomenon, it is not explicitly considered.
Fig. 5. Scheme for verification of the SIPT method by computer simulation.
Start-up behaviour in microclimatic conditions
The start-up behaviour of the system is considered a vital
performance index as it shows, under non-uniform irradiation,
how fast the MPP is reached and its convergence
pattern. The start-up performance of the proposed SIPT
method is studied under the following environmental
parameters:
i) irradiation – 600 W/m2, (ii) temperature –
25 °C and microclimatic conditions such as i) land surface
temperature – 25 °C, ii) humidity, and iii) wind speed at
nominal values of the considered location (Chennai and
Tiruvallur urban areas) as specified in section 5. During
tracking, the movement and the convergence of the interval
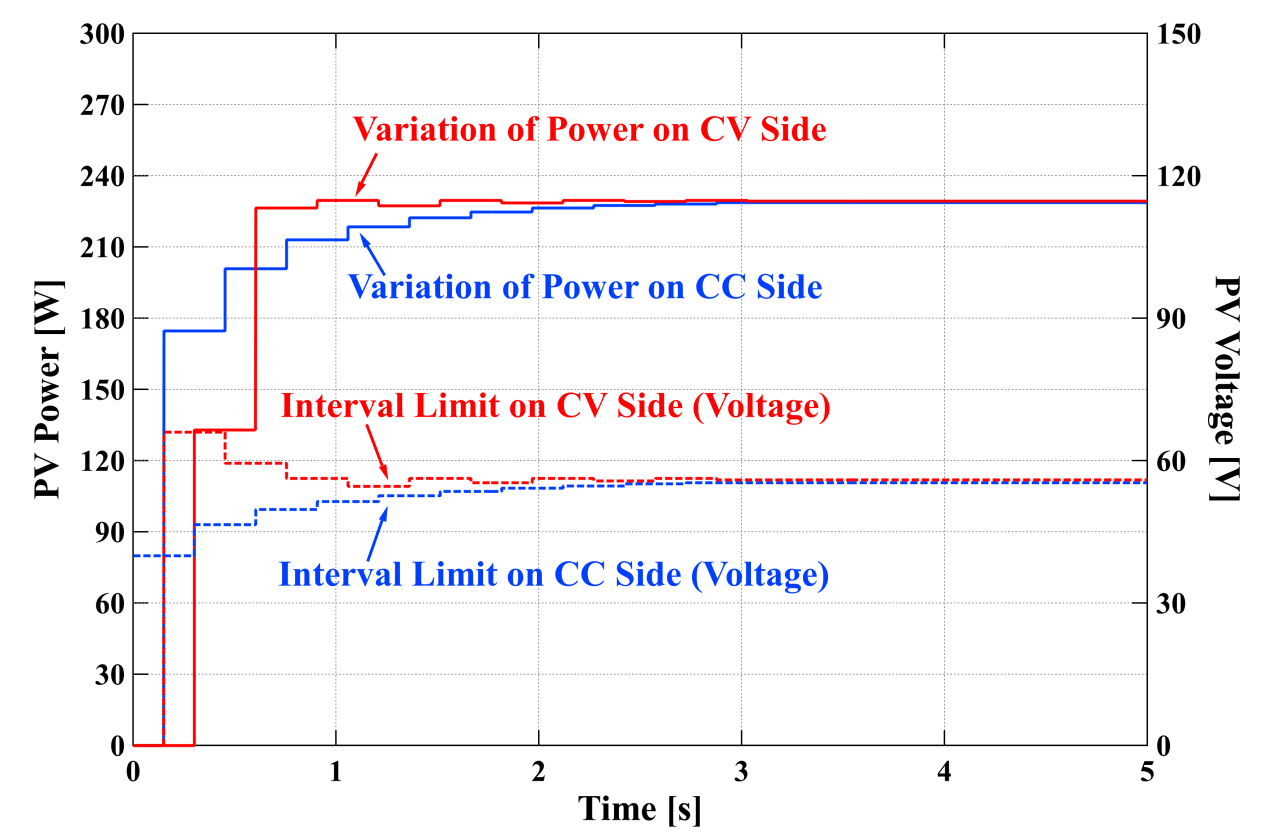
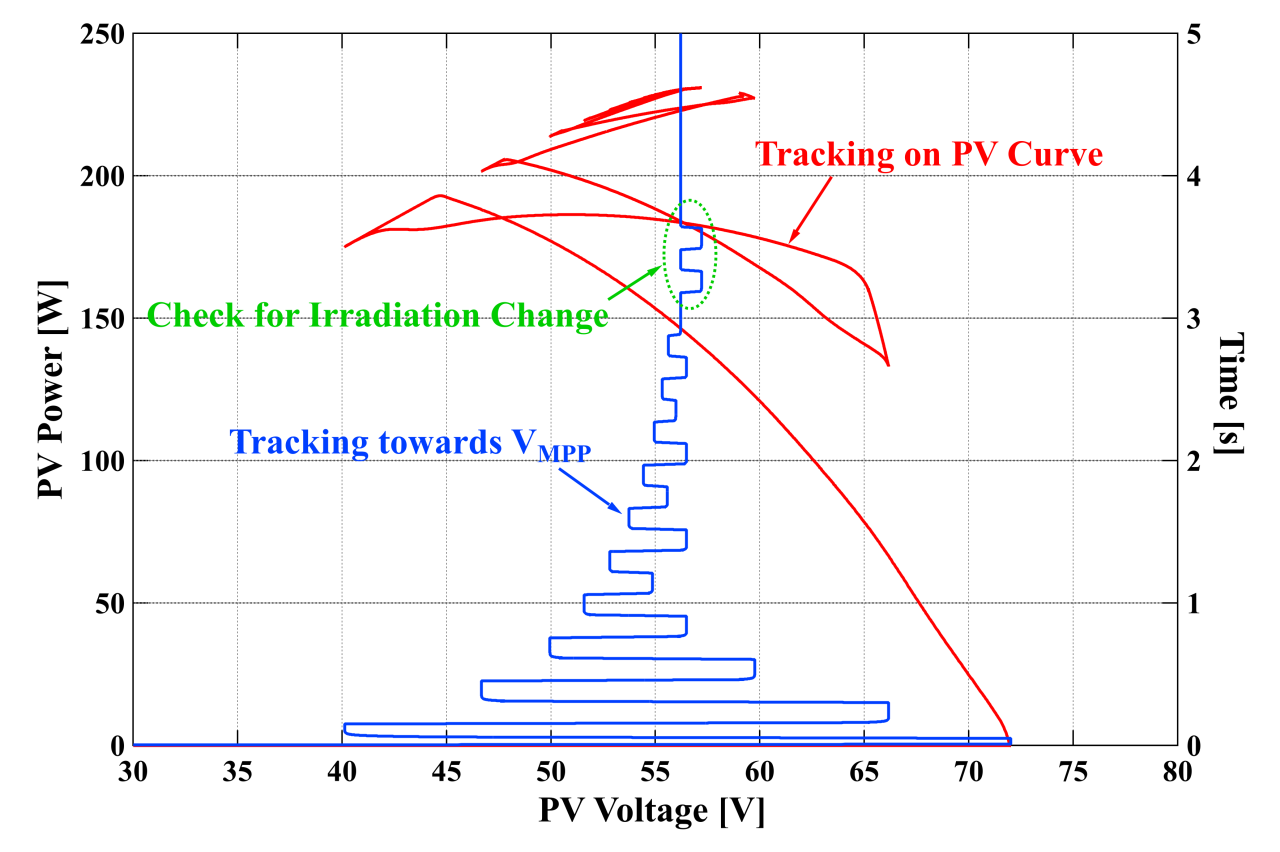
points and their corresponding powers are illustrated in Fig. 6. The net convergence behaviour of the SIPT method
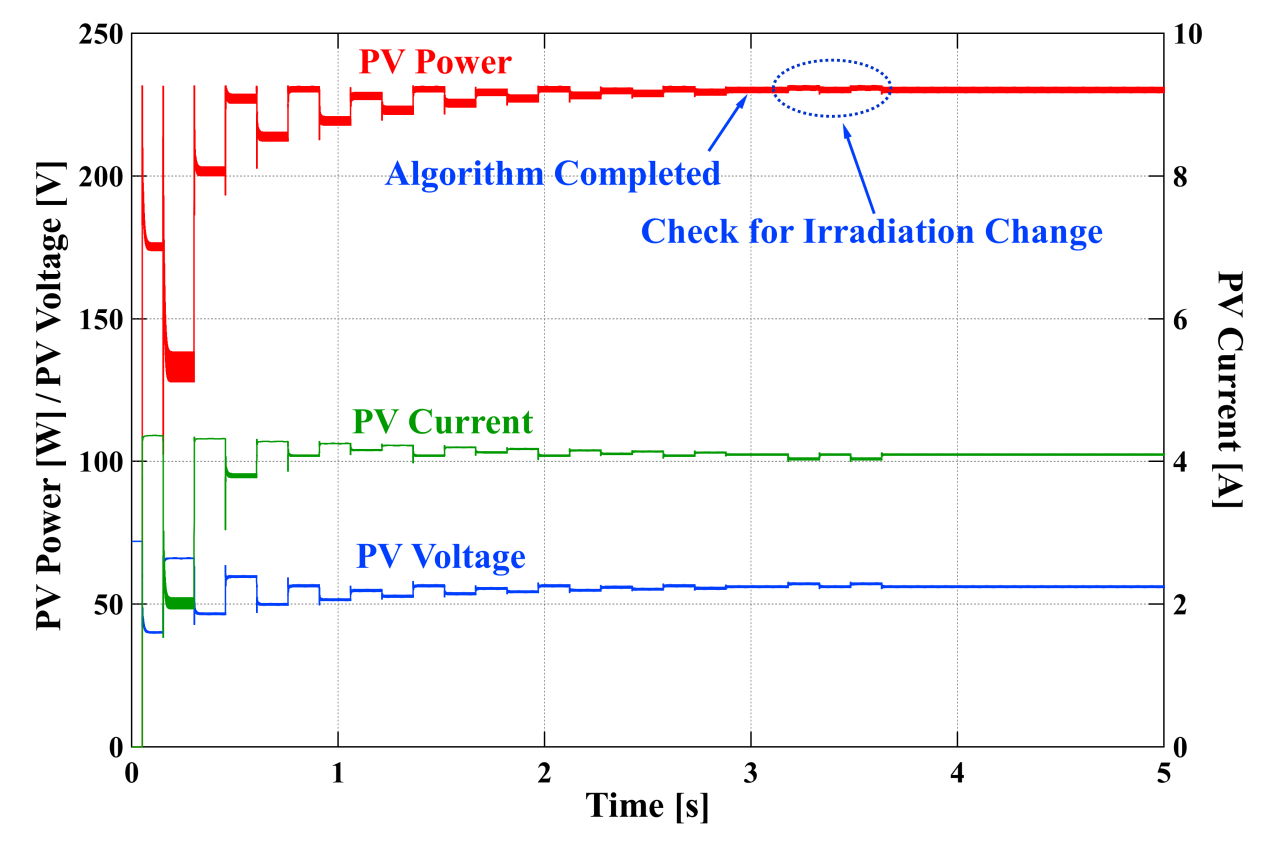
during start-up is illustrated in Fig. 7. From Fig. 6 and Fig. 7, SIPT tracking performance and its convergence
towards the MPP are appealing. The time variation of
PV power, voltage, and current are illustrated in Fig. 8.
Fig. 8. Time variation of PV power, voltage, and current at start-up.
From the simulation, after reaching a steady state, the power extracted from the PV array by the SIPT method is 230.21 W and the true maximum power, which is the peak power at a particular environmental condition, is 231.12 W.
Dynamic behaviour due to daily insolation (DI) is changed before reaching steady state
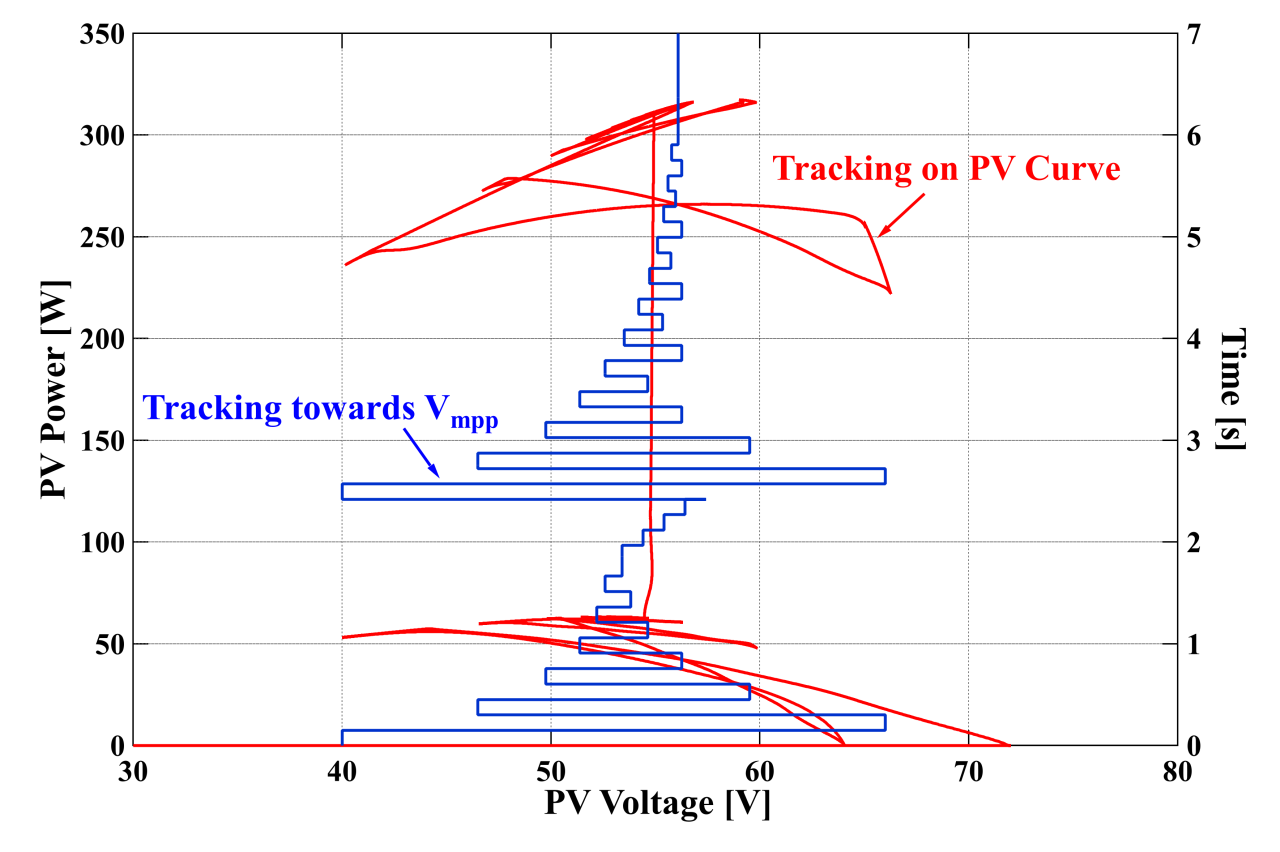
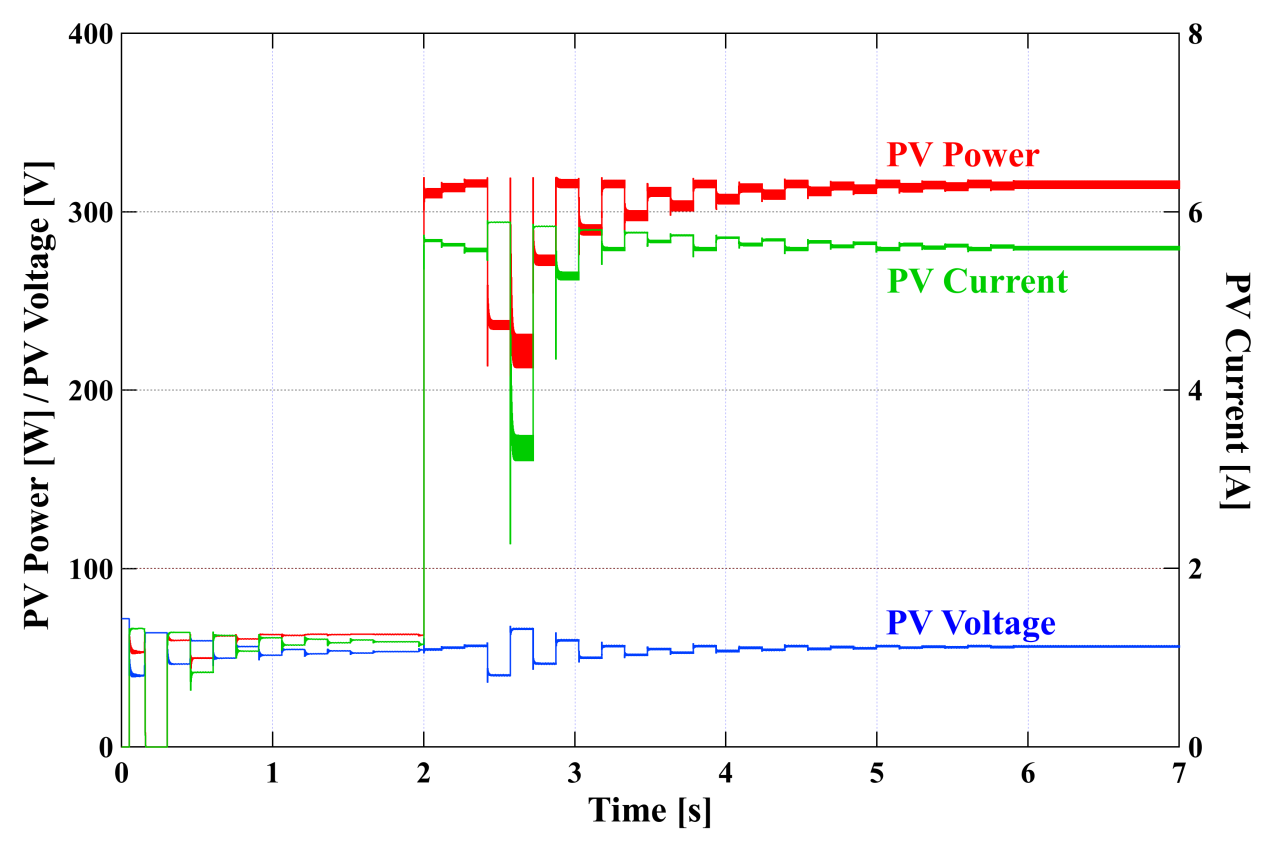
Dynamic behaviour was studied and the convergence performance was assessed under varying environmental microclimatic parameters such as (i) wind speed, (ii) humidity, and (iii) surface land temperature. The dynamic behaviour of the SIPT method is studied with the following environmental parameters: i) initial irradiation – 600 W/m2 at start-up, ii) initial irradiation – 200 W/m2, and final irradiation – 800 W/m2, where the change was initiated before reaching steady state, iii) initial irradiation – 500 W/m2 and final irradiation – 900 W/m2, where the change was initiated after reaching steady state, iv) temperature – 25 °C and nominal microclimatic parameters such as v) wind speed, vi) humidity, vii) surface land temperature. The change in the irradiation magnitude had been applied before SIPT and reached its steady state. The convergence behaviour and the time behaviour of PV parameters are illustrated in Fig. 9 and Fig. 10. In this case of dynamic behaviour, the final power extracted from the PV array after reaching the steady state is 315.46 W and a true maximum power is 318.1 W.
Fig. 10. Time variation of PV power, voltage, and current when irradiation is changed before steady state.
Dynamic behaviour of DI is changed after reaching steady state
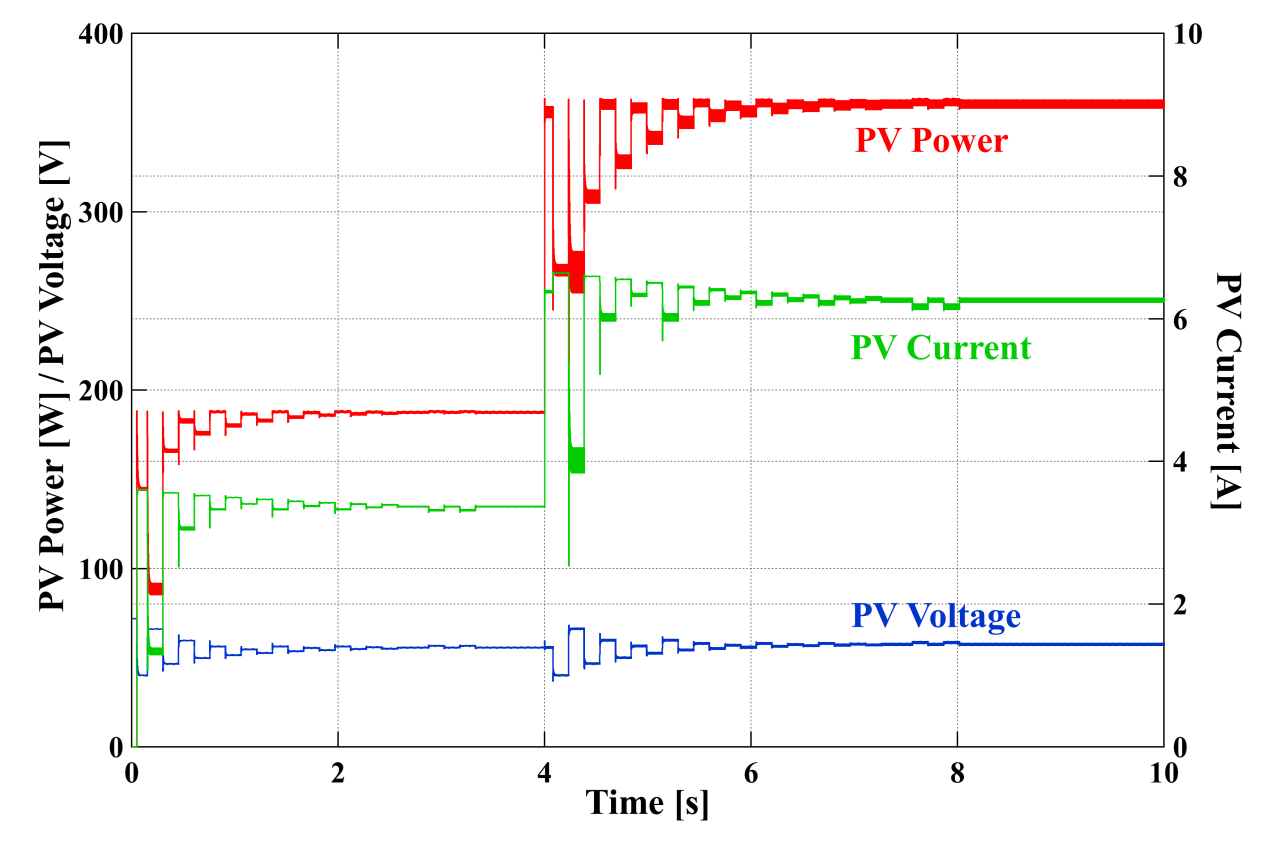
Performance characteristics of the SIPT method were investigated, when the magnitude of DI is changed after reaching steady state, and the behaviours are illustrated in Fig. 11 and Fig. 12 for convergence and combined time variation of power, voltage, and current, respectively.
Fig. 12. Time variation of PV power, voltage, and current when irradiation is changed after steady state.
A simulation study for this condition gives the final power extracted from the PV array after reaching steady state as 360.69 W and the true maximum power is 361.98 W.
The experimental bedtest of SIPT and BM-DT in different urban and rural locations
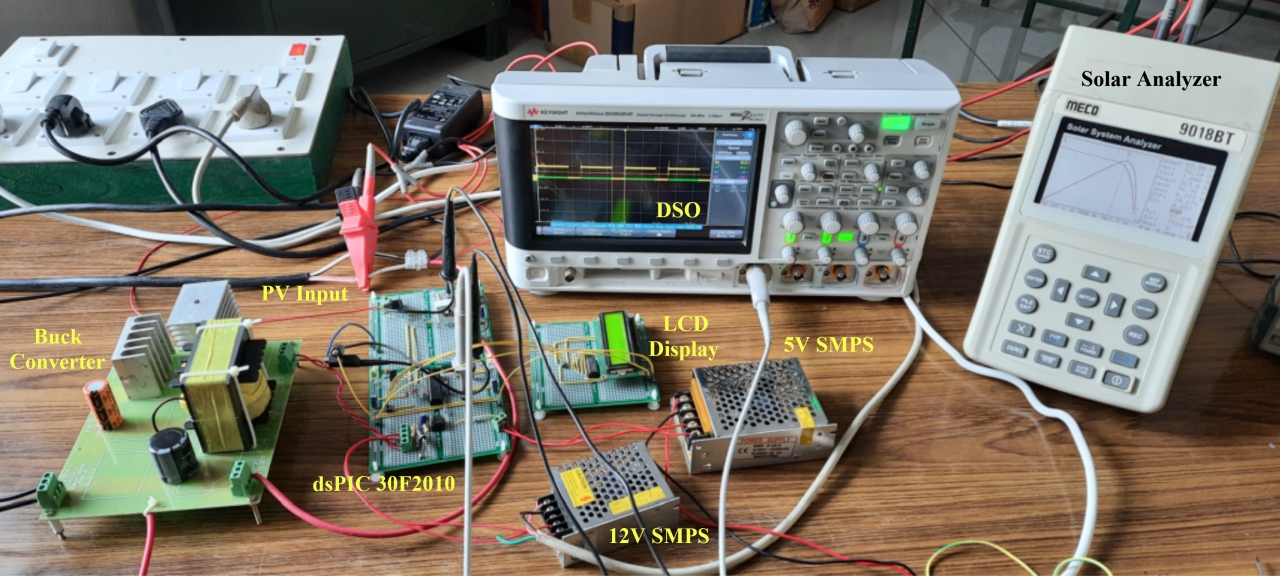
The bedtest is used to validate the SIPT method of MPPT and confirm the results obtained in the simulations. The experimental setup consists of: i) PV array consisting of four modules of 125 Wp each with (Voc = 21.8 V, Vmpp = 17.4 V) connected in series, ii) buck converter, iii) three 12 V batteries of 100 Ah capacity connected in series, and iv) control circuit configured around dsPIC30F2010. The values of the passive components used in the buck converter in the experimental testbed are the same as those of the values used in the simulation studies.
The following equipment take measurements: i) Keysight DSO DSOX3014T to monitor dynamics of the SIPT method, ii) Tektronix DSO TPS2024 to capture the PV parameters, and iii) MECO Solar Array Analyzer to find the true maximum power from the PV array. The experimental setup is shown in Fig. 13.
Fig. 13. Experimental set-up to verify the SIPT method.
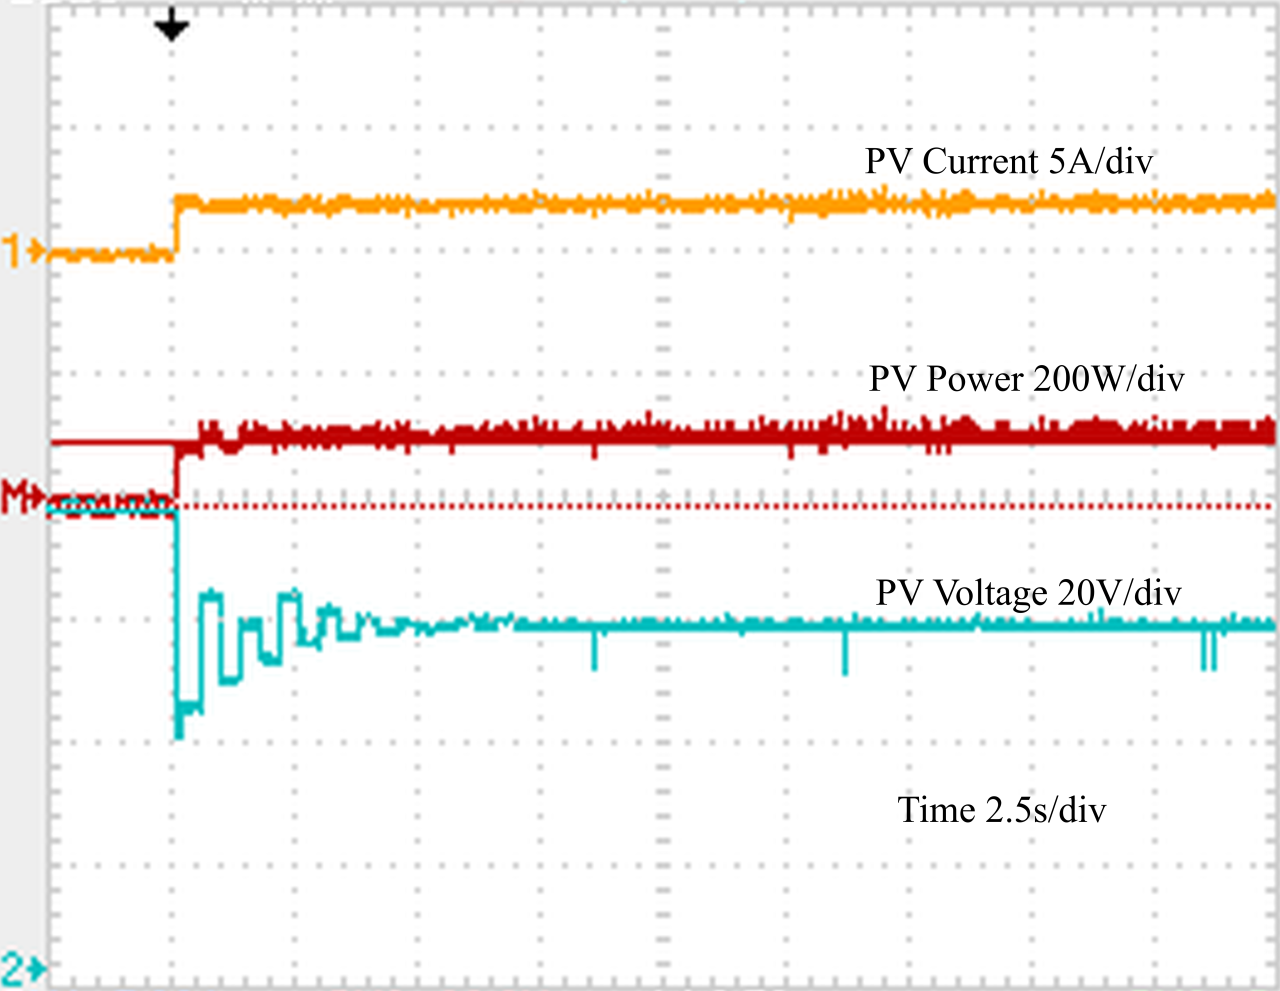
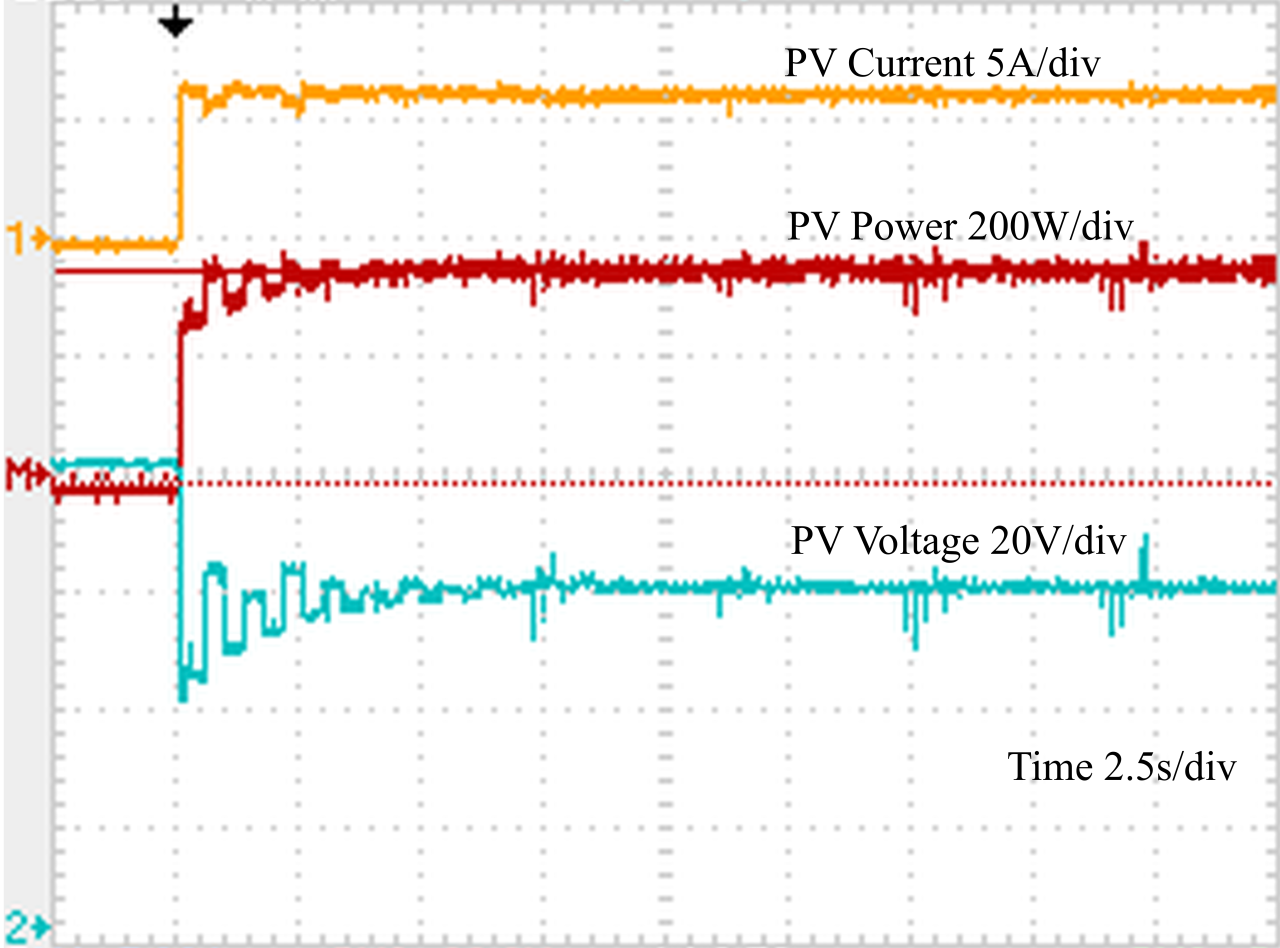
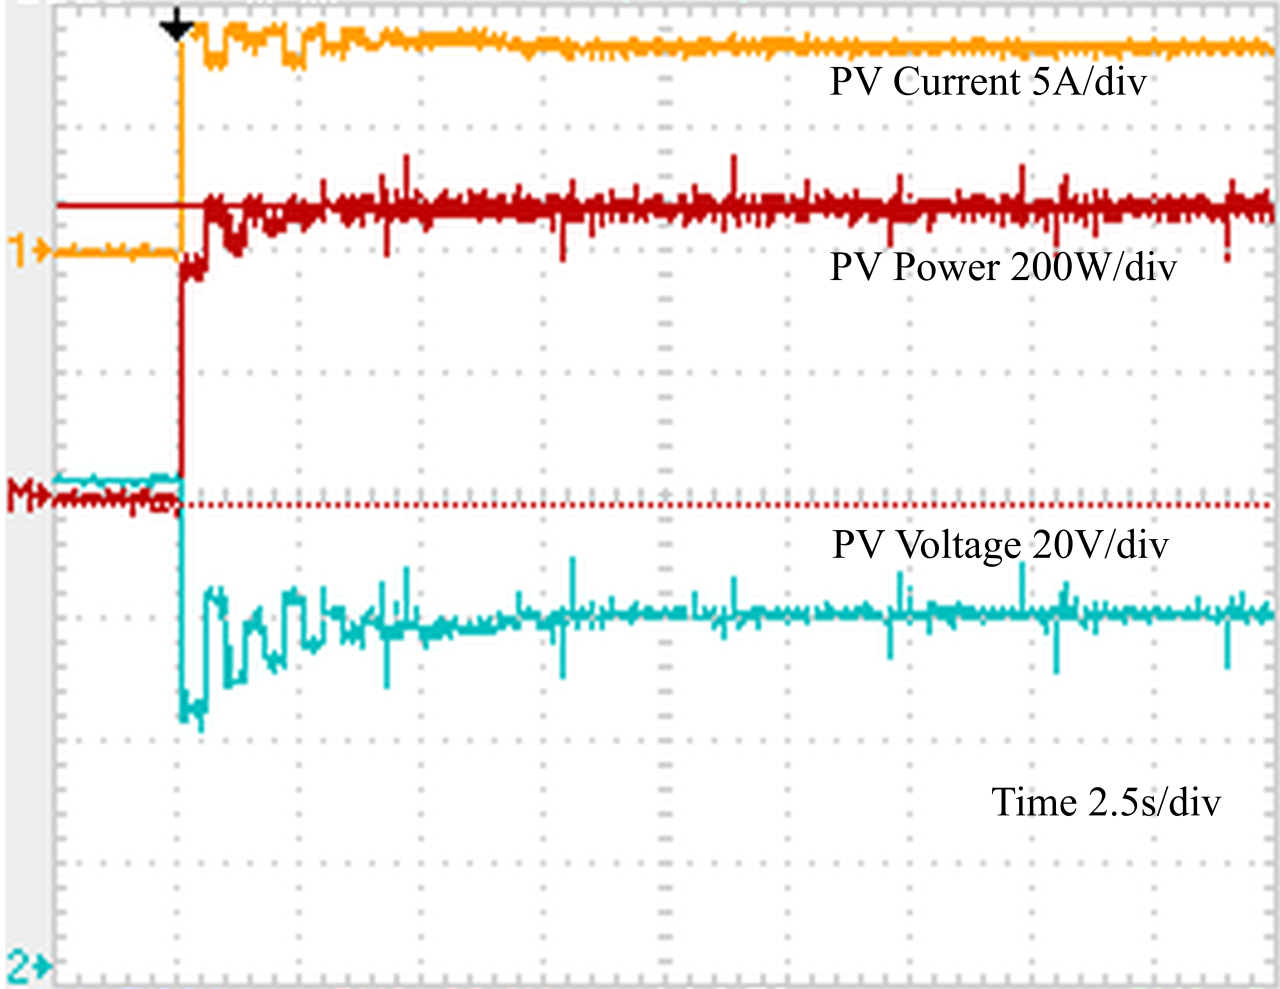
In the experimental study, an iteration step size fixed in the software is 400 msec producing better clarity in the illustrations. The start-up performance of the SIPT method is experimentally verified under a low power-level, medium-power level, and at a high-power level. Experimentally obtained results are shown in Fig. 14 to Fig. 16.
Fig. 16. Start-up behaviour of SIPT at high-power level.
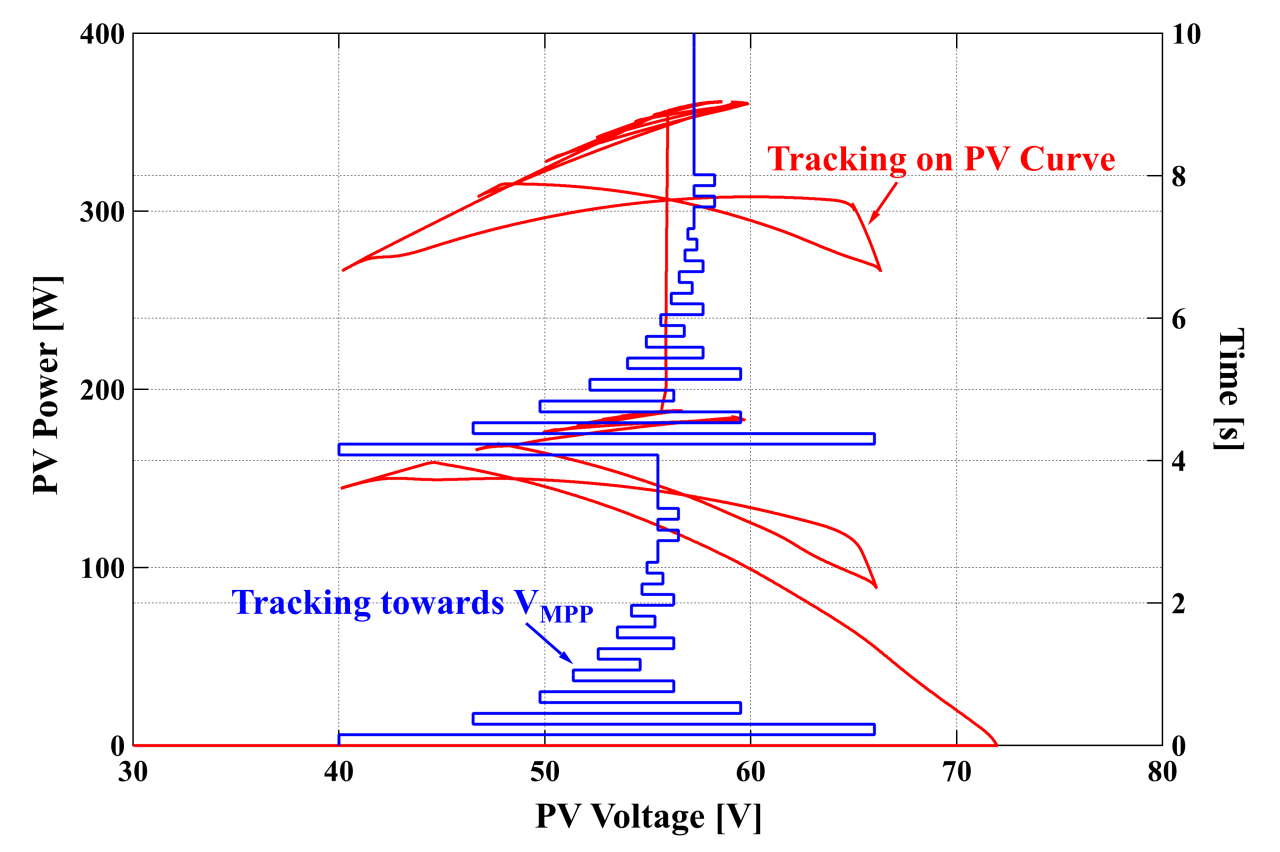
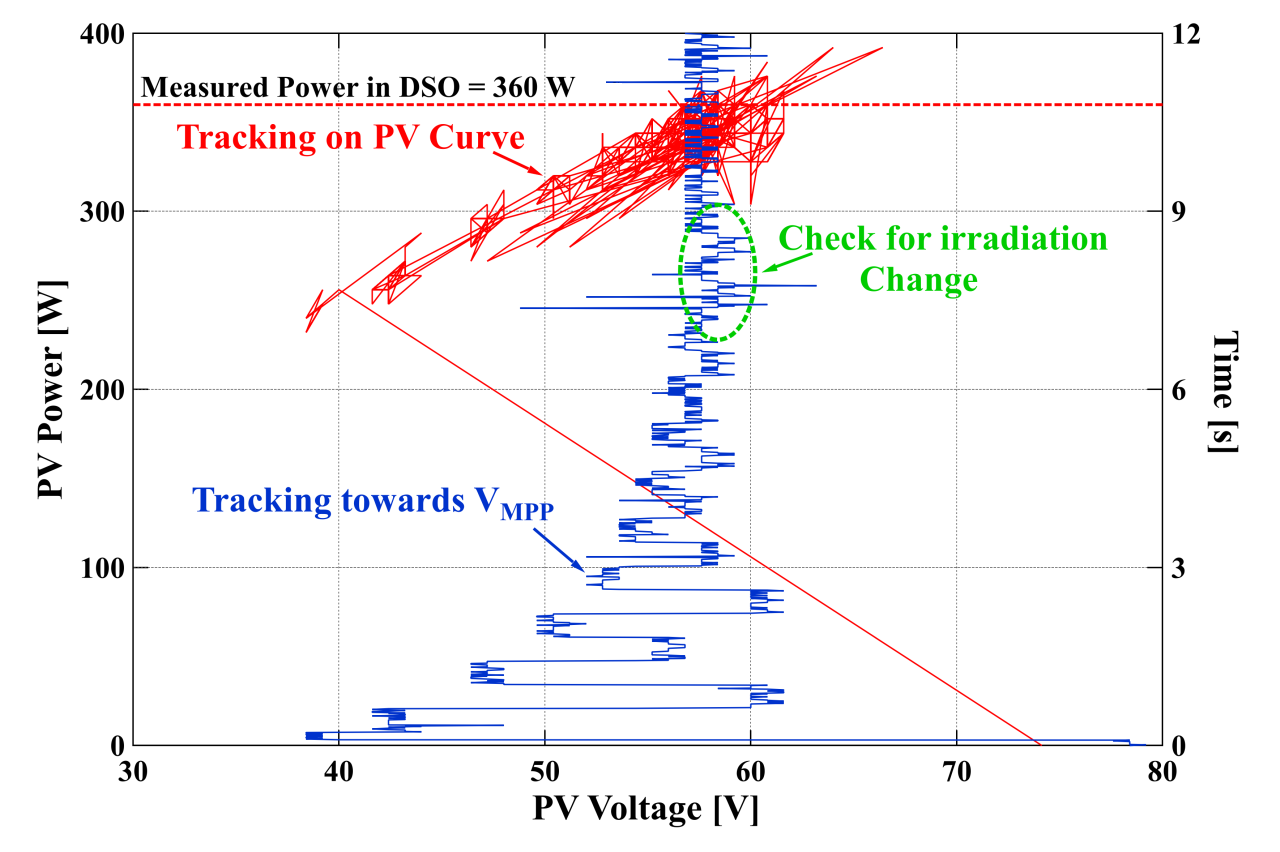
The extracted power from the PV array under the above-mentioned power levels is 104 W, 360 W, and 488 W, respectively, against the true maximum powers, which is the maximum power (peak power at a particular environ-mental condition) measured by a solar array analyser of 105 W, 363 W, and 491.6 W, as measured through the Solar Array Analyzer. The typical graphical illustration of the tracking and convergence performance of the SIPT method under medium-power level is obtained by superimposing the time variation in PV voltage towards the MPP on the power-voltage trace obtained from the data captured by a digital storage oscilloscope (DSO), as shown in Fig. 17, which gives an excellent correlation with the simulated results.
Fig. 17. Convergence behaviour of SIPT at medium-power level.
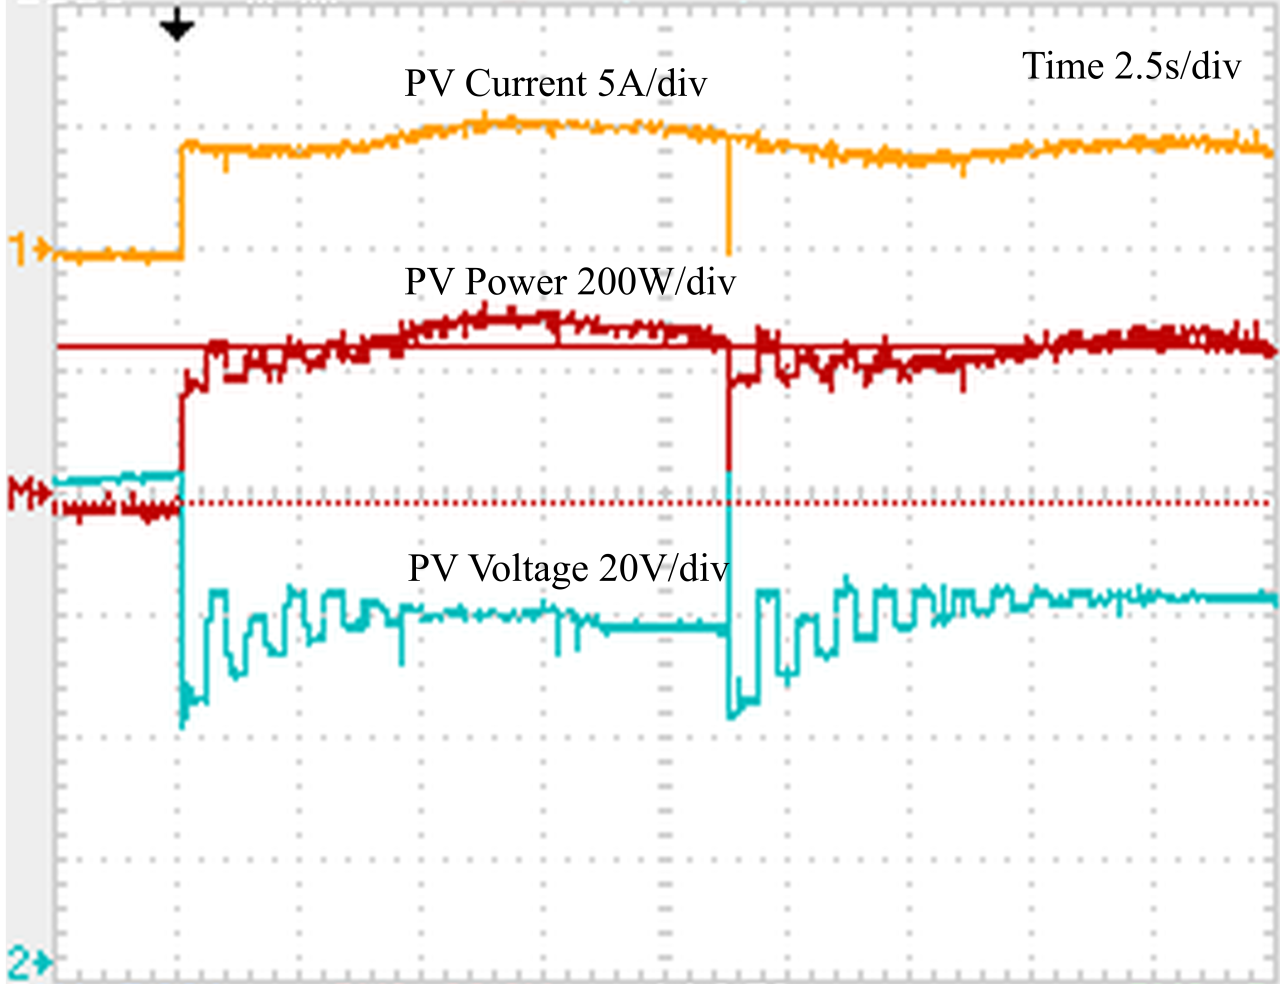
The performance of the SIPT method is verified under dynamic variation of DI during natural cloud movements and different microclimatic conditions. The tracking performance under such dynamic environmental conditions is shown in Fig. 18. This illustration shows the excellent behaviour of the SIPT method in tracking and convergence towards MPP.
Fig. 18. Dynamic behaviour of SIPT under natural variation of irradiation.
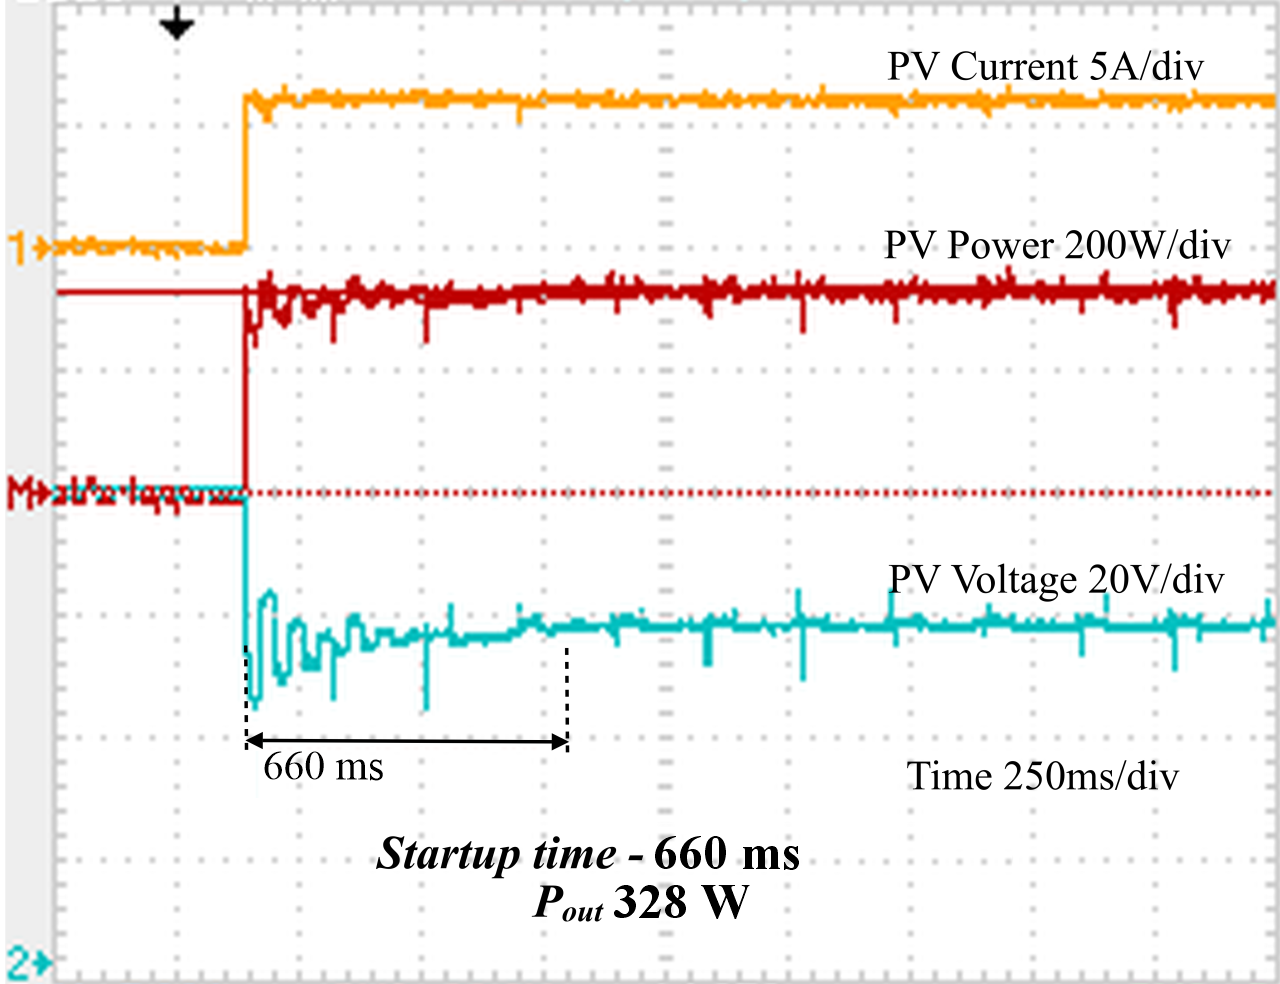
The speed of the tracking process depends on the proper design of the PI controller and its effect on the settling time of the PV array voltage to the set reference voltage given by the SIPT method. The settling time of the designed PI controller implemented with a 30F2010 dsPIC digital signal controller is 30 ms. Setting the iteration time period to 30 ms improves the tracking speed and the convergence time of the proposed method is measured at 660 ms. The converging performance with this iteration time period is captured using a digital storage oscilloscope and illustrated in Fig. 19.
Fig. 19. Illustration of convergence time with an iteration time of 30 ms.
Results and discussion
The proposed SIPT method with BM-DT prediction is intro-duced in this paper and has an excellent tracking perfor-mance and power extraction efficiency. This is obvious from the simulation study which is performed under three different situations as presented in section 4; the power extraction efficiencies are calculated as 99.6%, 99.1%, and 99.6%, with an excellent tracking performance. This has clearly shown the SIPT method success with BM-DT prediction in MPPT. The tracking process precisely follows the algorithm used to implement the SIPT method.
The experimental verification of the SIPT method showed a testimony to its performance and exhibited an excellent correlation with the simulation results. The experimental study made at three different power output levels has produced a well-acceptable tracking performance with outstanding power extraction efficiencies at low, medium, and high-power levels as 99%, 99.2%, and 99.4%, respectively. The accuracy of the measured results is well within ± 2% of the absolute readings. In addition, the tracking speed of the SIPT method under DI and urban microclimatic conditions of MPP is shown as 660 ms with the dsPIC30F2010 digital signal controller. Furthermore, tracking convergence is well-established under naturally varying DI and urban microclimatic conditions without any divergence. Altogether, the overall performance of the SIPT method of MPPT is shown through simulation and experimental results and leads to this proposed method being an excellent method for PV array applications with uniform irradiation.
DI in urban areas and solar panels
DI refers to solar radiation that reaches the Earth’s surface after being scattered by atmospheric particles, clouds, and other obstructions. This type of radiation is crucial for solar energy applications, particularly in urban environments where buildings can obstruct direct sunlight. DI is very high in urban areas. Urban areas typically experience different patterns of DI compared to rural settings due to factors such as building density, pollution, and atmospheric conditions. For instance, studies have shown that cities like Chennai in Tamil Nadu, India receive varying amounts of DI depending on the season and local atmospheric conditions. On clear days, Chennai areas receive up to 15.6% more DI in June than nearby rural areas like Tiruvallur in Tamil Nadu. The presence of particulate matter and urban heat can enhance scattering, thus increasing the diffuse component of solar radiation. The impact on solar panel performance during MPP is higher. Fig. 20 shows the DI due to high buildings near solar panels.
Fig. 20. DI due to high buildings near solar panels.
Solar panels can use direct and diffuse solar radiation, making them effective even in less-than-ideal conditions. The amount of DI influences the performance of PV systems. DI is the sunlight that reaches the panels directly from the Sun.
DI is critical during times when clouds
obscure direct sunlight. Due to this diffused light, PV
systems can still generate electricity under overcast
conditions. This study indicates that urban environments
can significantly affect the DI available to solar panels. For
example, a study highlighted the importance of modelling
DI on tilted surfaces in urban settings, considering factors
like building orientation and surrounding structures. Table 1 and Table 2 show the DI and predicted outpower of the
proposed BM-DT algorithm for Chennai urban area and
Tiruvallur rural area, respectively, where DI represents
the daily insolation, H represents the humidity in %,
T represents the temperature of the area in °C, and W
represents the wind speed in mph, Pout and Pin represent
the output and input power in watts, and η is the efficiency
in %.
DI and predicted outpower of the proposed BM-DT algorithm (Tiruvallur rural area).
Date and time
Day – D; Evening – E
DI
(MJ/m2/day)
T
(°C)
H
(%)
W
(mph)
Pout (W) Actual
Pout (W) Predicted
η
(%)
17/5/24(D)
15.32
28
90
9
350
346
98.86
18/6/24(E)
14.32
26
84
10
345
342
99.13
25/8/24(D)
13.25
25
86
9
354
352
99.43
26/9/24(D)
12.36
24
89
11
356
350
98.31
2/9/24 (D)
14.25
25
85
10
400
398
99.50
22/9/24(E)
17.39
26
80
12
412
411
99.75
29/9/24(E)
16.27
27
81
10
425
421
99.05
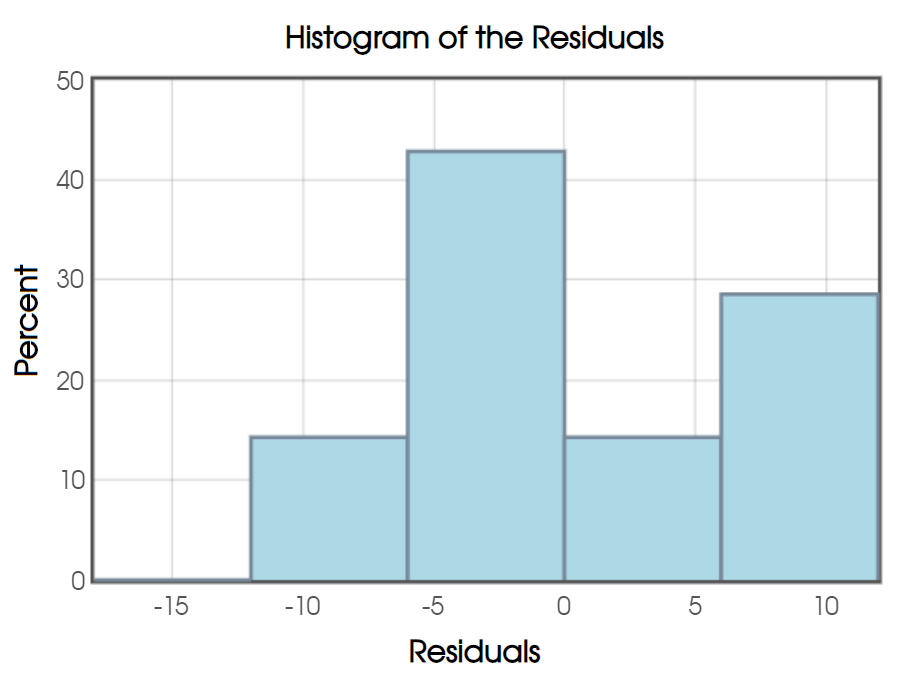
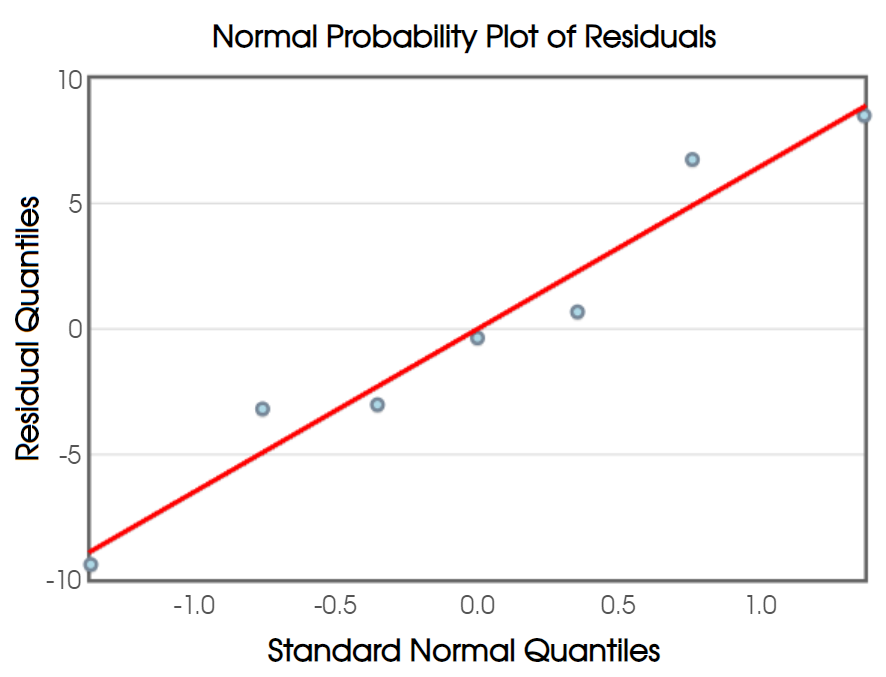
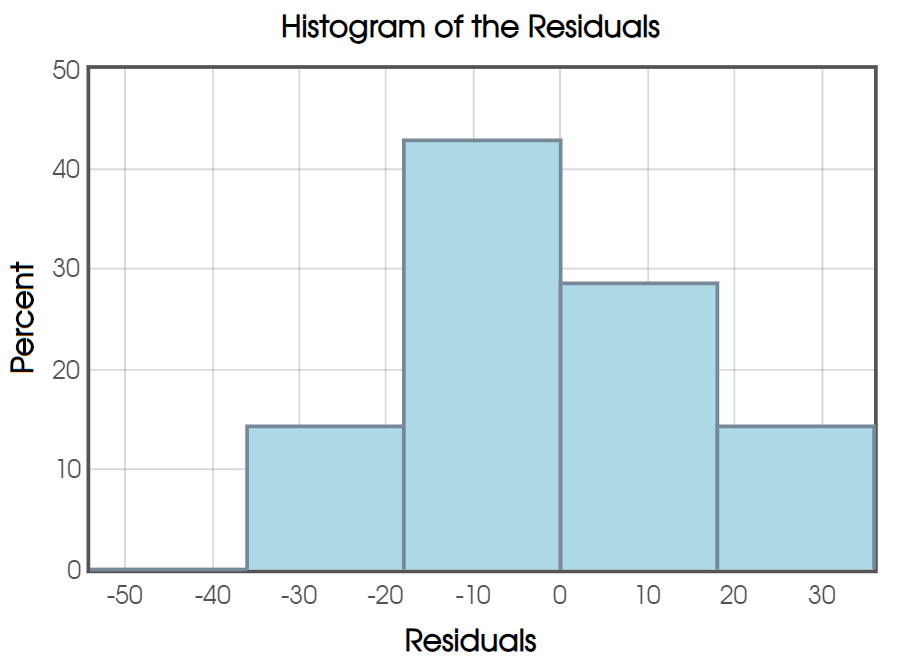
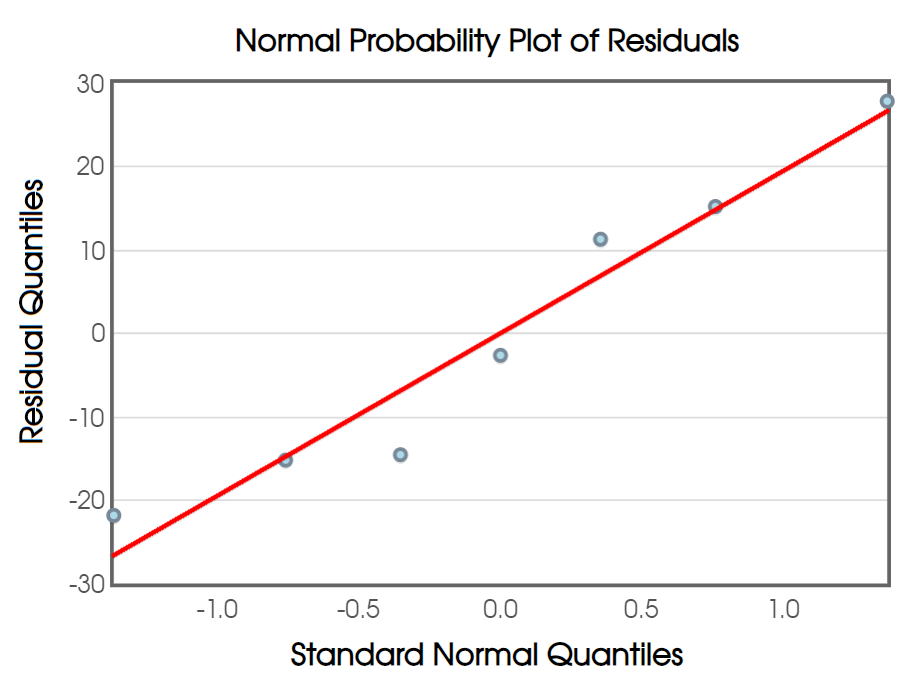
Fig. 21 shows (a) a histogram of residuals,
(b) a standard probability plot of residuals for the Chennai
urban area, and Fig. 22 shows the same for the Tiruvallur
rural area. histogram allows analysts to inspect whether the
residuals are approximately normally distributed visually.
This is crucial because many statistical tests and confidence
intervals rely on the assumption of normality in residuals.
Fig. 22. (a) Histogram of residuals, (b) normal probability plot of residuals for Tiruvallur rural area.
This study used accuracy, specificity, and sensitivity in
solar testing. Sensitivity (true positive rate) measures the
proportion of actual positives that are correctly identified
by the test.
where TN = true negatives (correctly identified negative
cases) and FP = false positives (actual negatives incorrectly
identified as positive).
Accuracy measures the overall correctness of the test,
indicating the proportion of true results (both positives and
negatives) among the total number of the cases examined.
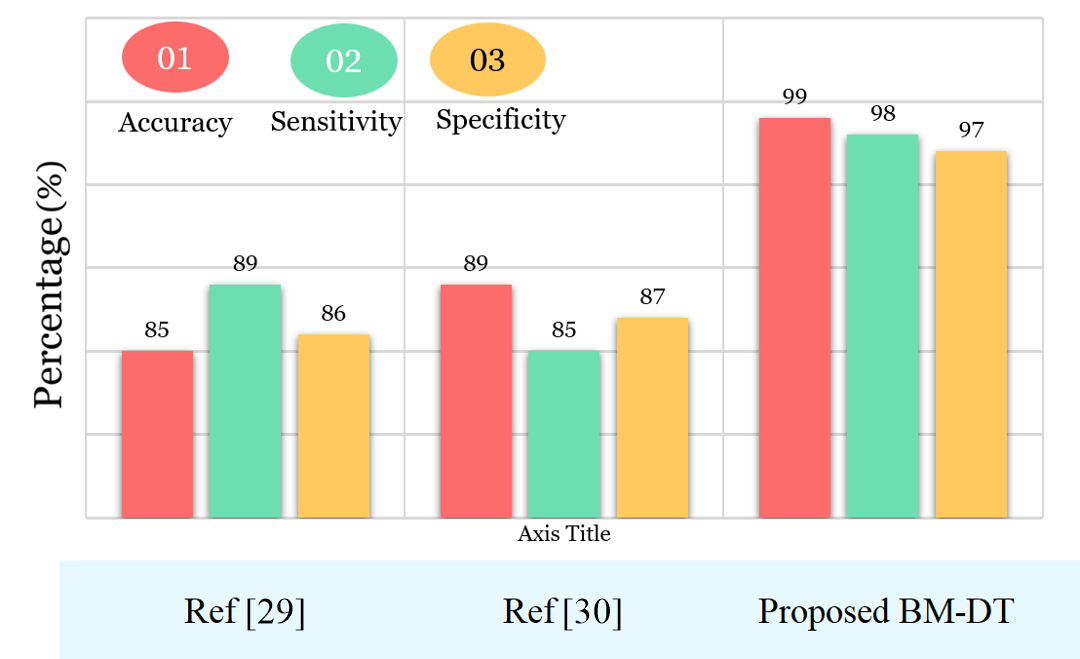
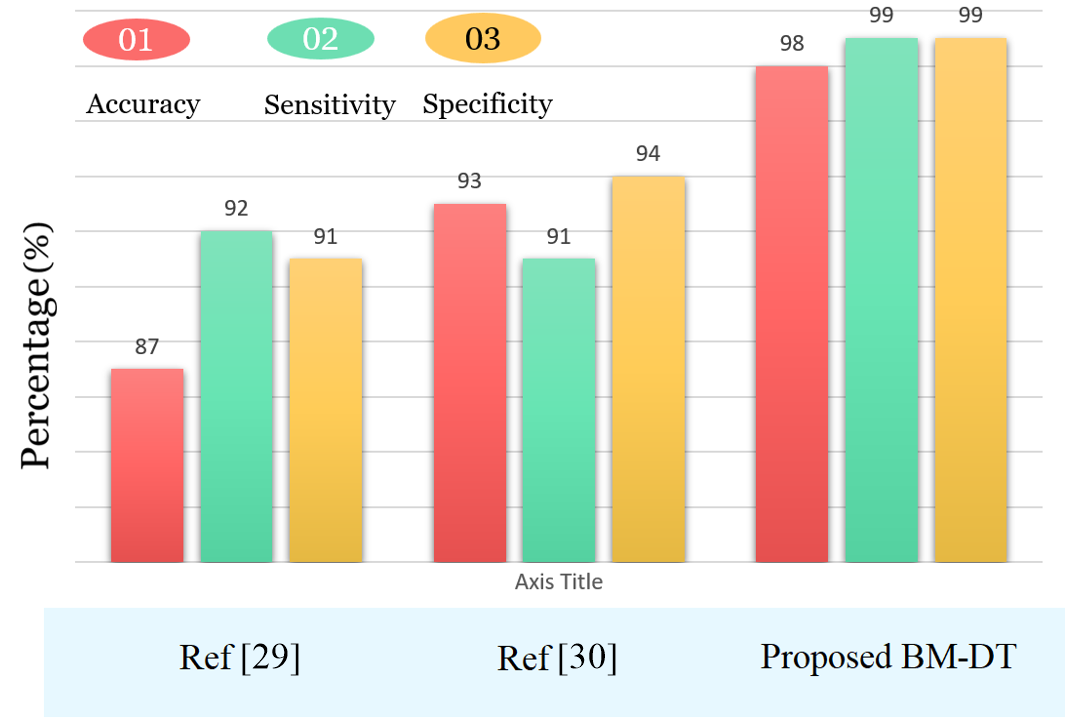
Fig. 23 compares the performance metrics such as accuracy, sensitivity, and specificity of the proposed Bayesian-optimized decision tree model with the two benchmark methods presented in [29] and [30] at Chennai urban area, whereas Fig. 24 does the same for Tiruvallur rural area. The diffuse horizontal irradiance is measured with a pyranometer shaded by a shadow ball.
Fig. 24. Accuracy and specificity for the proposed BM-DT (Tiruvallur rural area).
Discussion
MPPT algorithms are used for optimizing the energy output of PV systems during different environmental conditions. The output characteristics of PV cells are nonlinear and vary with different irradiance levels. As DI increases, the overall power output of the PV system is changed and affects the location of the MPP on the voltage-current (V-I) curve. Under conditions of a high DI, MPP shifts and requires MPPT algorithms to adapt quickly to maintain optimal performance. When MPPT algorithm is slow to respond, it may not effectively capture the maximum available power, which leads to reduced efficiency.
In summary, DI plays a critical role in determining the efficiency of MPPT systems in PV applications. The ability of the MPPT algorithm to adapt to changing irradiance conditions, especially those involving significant diffuse radiation, has greatly influenced the overall energy production. Proper sensor calibration and choice of MPPT technique are essential for optimizing performance under varying atmospheric conditions. The presence of DI alters the power output characteristics of PV panels. As diffuse radiation increases, the PV system voltage-current (V-I) curve changes, shifting the MPP upwards. MPPT algo-rithms must continuously adapt to these changes to optimize energy capture effectively.
The distribution of residuals obtained from the Bayesian-optimized regression model presented in histogram in Fig. 21(a) and Fig. 22(a) is divided into bins to group residuals, showcasing their distribution. A majority of the residuals are concentrated near the zero-residual value, indicating a low average deviation between predicted and actual values, which reflects the accuracy of the Bayesian-optimized regression in estimating the MPP. The histogram indicates the effectiveness of the optimization technique. The concentration of residuals around zero suggests that the model minimizes prediction errors, making it suitable for the applications. The histogram also validates the model effectiveness in minimizing errors for power output predictions under varying solar conditions.
Examining normality over a wider range of residuals captures extreme cases where predictions significantly deviate in the form of normal probability plot to assess the normality of residuals from the regression model in Fig. 21(b) and Fig. 22(b). These figures demonstrate the model sensitivity to unusual solar or environmental conditions. All the residuals were closely aligned with the diagonal line, indicating that the model errors are approximately normally distributed and that the proposed Bayesian regression model is robust. The normality of residuals is crucial for ensuring the reliability of the Bayesian optimization in tracking the true MPP.
Further from the charts in Fig. 23 and Fig. 24, corresponding to two different locations, the performance of the proposed method of MPPT has outperformed the other two techniques mentioned in [29] and [30] with respect to the accuracy of tracking and sensitivity to environmental parameters, and specificity in tracking to reach the MPP under uniform irradiation without any divergence. These qualities underscore the proposed BM-DT model reliability and robustness in adapting to the nonlinear characteristics of solar MPPT systems and substantiate their reliability and effectiveness in optimized power extraction form PV modules.
DI notably influences the efficiency of MPPT algorithms due to its impact on the power output characteristics of PV systems. Algorithms that can quickly adapt to changes in diffuse radiation, such as INC, tend to perform better than those that do not adjust as dynamically, such as P&O. Understanding these dynamics is essential for optimizing energy production, especially in environ-ments with variable cloud cover and diffuse light conditions. The proposed BM-DT algorithm performs the adaptation within 660 ms on average based on microclimatic conditions parameters, whereas P&O method adaptation time is 990 ms on average with microclimatic data.
Conclusions
A new method to track the MPP by sub-interval prediction using the BM-DT method for a PV array under DI and different urban microclimatic conditions is presented in this paper. The proposed SIPT method is verified through software simulations. These simulations have confirmed its validity regarding attaining the MPP with greater accuracy and convergence. Experimental verifications were carried out to confirm the validity of the proposed SIPT and BM-DT methods. It is shown that there was an excellent congruence between the results obtained through simulations and experimental work. Moreover, it has been shown that the time taken by the proposed method has an MPP of 660 ms using a low-cost digital signal controller. The performance of the presented method with changes in ID and urban microclimatic condition levels is excellent with appealing convergence; in addition, the efficiency in power extraction with different ID levels and urban microclimatic conditions is more than 99%.
Moreover, due to an excellent estimation of MPP and the proposed technique good reliability and robustness, the user can extract optimal power from PV modules with very good efficiency. Further, as the adaptation time is very short without any divergence in tracking compared with other techniques, the user can obtain a very good overall efficiency in power extraction using the proposed BM-DT method. Finally, as the system is configured around a low-cost digital signal controller with less complexity and computation, the overall cost of the MPP tracker using the proposed technique is lower and affordable to any user.
Authors’ statement
Research concept and design, collection and/or assembly of data, data analysis and interpretation, writing the article, Jenifer Suriya L.J. and Christy Mano Raj J.S.; critical revision of the article, Jenifer Suriya L.J.; final approval of article, Christy Mano Raj J.S.
References
Pandey, A., Dasgupta, N. & Mukerjee, A. K. Design Issues in Implementing MPPT for Improved Tracking and Dynamic Performance. in IECON 2006 – 32nd Annual Conference on IEEE Industrial Electronics 4387–4391 (IEEE, 2006). https://doi.org/10.1109/IECON.2006.348008
Mei, Q., Shan, M., Liu, L. & Guerrero, J. M. A novel improved variable step-size incremental-resistance MPPT method for PV systems. IEEE Trans. Ind. Electron. 58, 2427–2434 (2011). https://doi.org/10.1109/TIE.2010.2064275
Jiang, Y., Abu Qahouq, J. A. & Haskew, T. A. Adaptive step size with adaptive-perturbation-frequency digital MPPT controller for a single-sensor photovoltaic solar system. IEEE Trans. Power Electron. 28, 3195–3205 (2013). https://doi.org/10.1109/TPEL.2012.2220158
Femia, N., Petrone, G., Spagnuolo, G. & Vitelli, M. Optimization of perturb and observe maximum power point tracking method. IEEE Trans. Power Electron. 20, 963–973 (2005). https://doi.org/10.1109/TPEL.2005.850975
Swaminathan, N., Lakshminarasamma, N. & Cao, Y. A fixed zone perturb and observe MPPT technique for a standalone distributed PV system. IEEE J. Emerg. Sel. Topics Power Electron. 10, 361–374 (2022). https://doi.org/10.1109/JESTPE.2021.3065916
Ali, A. I. M. Sayed, M. A. & Mohamed, E. E. M. Modified efficient perturb and observe maximum power point tracking technique for grid-tied PV system. Int. J. Electr. Power Energy Syst. 99, 192–202 (2018). https://doi.org/10.1016/j.ijepes.2017.12.029
Necaibia, S., Kelaiaia, M. S., Labar, H., Necaibia, A. & Castronuovo, E. D. Enhanced auto-scaling incremental conductance MPPT method, implemented on low-cost microcontroller and SEPIC converter. Sol. Energy 180, 152–168 (2019). https://doi.org/10.1016/j.solener.2019.01.028
Raiker, G. A., Loganathan, U. & Subba Reddy, B. Current control of boost converter for PV interface with momentum-based perturb and observe MPPT. IEEE Trans. Ind. Appl. 57, 4071–4079 (IEEE, 2021). https://doi.org/10.1109/TIA.2021.3081519
Abouadane, H., Fakkar, A., Sera, D., Lashab, A., Spataru, S. & Kerekes, T. Multiple-power-sample based P&O MPPT for fast- changing irradiance conditions for a simple implementation. IEEEJ. Photovolt. 10, 1481–1488 (IEEE, 2020). https://doi.org/10.1109/JPHOTOV.2020.3009781
Ahmed, J. & Salam, Z. An improved perturb and observe (P&O) maximum power point tracking (MPPT) algorithm for higher efficiency. Appl. Energy 150, 97–108, 2015. https://doi.org/10.1016/j.apenergy.2015.04.006
Belkaid, A., Colak, I. & Isik, O. Photovoltaic maximum power point tracking under fast varying of solar radiation. Appl. Energy 179, 523–530 (2016). https://doi.org/10.1016/j.apenergy.2016.07.034
Pathak, P. K., Padmanaban, S., Yadav, A. K., Alvi, P. A. & Khan, B. Modified incremental conductance MPPT algorithm for SPV- based grid-tied and stand-alone systems. IET Gener. Transm.Distrib. 16, 776–791 (2022). https://doi.org/10.1049/gtd2.12328
Devi, V. K., Premkumar, K., Bisharathu Beevi, A. & Ramaiyer, S. A modified Perturb & Observe MPPT technique to tackle steady state and rapidly varying atmospheric conditions. Sol. Energy 157, 419–426 (2017). https://doi.org/10.1016/j.solener.2017.08.059
Zadeh, M. J. Z. & Fathi, S. H. A new approach for photovoltaic arrays modelling and maximum power point estimation in real operating conditions. IEEE Trans. Ind. Electron. 64, 9334–9343 (2017). https://doi.org/10.1109/TIE.2017.2711571
Ahmed, M., Abdelrahem, M., Harbi, I. & Kennel, R. An adaptive model-based MPPT technique with drift-avoidance for grid- connected PV systems. Energies 13, 6656–6680 (2020). https://doi.org/10.3390/en13246656
Li, Q. et al. An improved perturbation and observation maximum power point tracking algorithm based on a PV module four- parameter model for higher efficiency. Appl. Energy 195, 523–537 (2017). https://doi.org/10.1016/j.apenergy.2017.03.062
Peng, L., Zheng, S., Chai, X. & Li, L. A novel tangent error maximum power point tracking algorithm for photovoltaic system under fast multi-changing solar irradiances. Appl. Energy 210, 303– 316 (2018). https://doi.org/10.1016/j.apenergy.2017.11.017
Li, S., Ping, A., Liu, Y., Ma, X. & Li, C. A variable-weather- parameter MPPT method based on a defined characteristic resistance of photovoltaic cell. Sol. Energy 199, 673–684 (2020). https://doi.org/10.1016/j.solener.2020.02.065
Yap, K. Y., Sarimuthu, C. R. & Lim, J. M.-Y. Artificial intelligence based MPPT techniques for solar power system: A review. J. Mod. Power Syst. Clean Energy 8, 1043–1059 (2020). https://doi.org/10.35833/MPCE.2020.000159
Kermadi, M. & Berkouk, E. M. Artificial intelligence-based maximum power point tracking controllers for photovoltaic systems: Comparative study. Renew. Sustain. Energy Rev. 69, 369–386 (2017). https://doi.org/10.1016/j.rser.2016.11.125
Çelik, Ö. & Teke, A. A hybrid MPPT method for grid connected photovoltaic systems under rapidly changing atmospheric conditions. Electr. Power Syst. Res. 152, 194–210 (2017). https://doi.org/10.1016/j.epsr.2017.07.011
Bataineh, K. Improved hybrid algorithms-based MPPT algorithm for PV system operating under severe weather conditions. IET Power Electron. 12, 703–711 (2019). https://doi.org/10.1049/iet-pel.2018.5651
Zhou, Y., Ho, C. N. M. & Siu, K. K.-M. A fast PV MPPT scheme using boundary control with second-order switching surface. IEEEJ. Photovolt. 9, 849–857 (2019). https://doi.org/10.1109/JPHOTOV.2019.2899470
Kwaśnicki, P. et al. Characterization of the TCO layer on a glass surface for PV IInd and IIIrd generation applications. Energies 17, 3122 (2024). https://doi.org/10.3390/en17133122
Christy Mano Raj, J. S. & Jeyakumar, A. E. A two stage successive estimation based maximum power point tracking technique for photovoltaic modules. Sol. Energy 103, 43–61 (2014). https://doi.org/10.1016/j.solener.2014.01.042
Padmavathi, N., Chilambuchelvan, A. & Shanker, N. R. Maximum power point tracking during partial shading effect in PV system using machine learning regression controller. J. Electr. Eng. Technol. 16, 737–748 (2021). https://doi.org/10.1007/s42835-020-00621-4
Ishrat, Z., Gupta, A. K. & Nayak, S. A comprehensive review of MPPT techniques based on ML applicable for maximum power in solar power systems. J. Renew. Energy Environ. 11, 28–37 (2024). https://doi.org/10.30501/jree.2023.385661.1556